

Operating Deflection Shape (ODS) Analysis helps users understand the dynamics of the unit under test by animating the test structure’s vibration. As the term suggests, the structure’s deformation during operating conditions is visualized. This aids in understanding the forced response of the test unit. The amplitude and phase of the vibration experienced is animated with a contour plot which also helps in visualizing the intensity and distribution of vibration.
Information from the deformation of the test structure and the region experiencing higher or lower deformation in the respective direction helps improve the structural properties of the test unit by adding damping, changing the stiffness, or redistributing the mass.
EDM Modal Operational Deflection Shape (ODS) software allows users to better visualize the deformation of the structure under test. The time domain data and spectrum data are animated using the animation feature of the geometry model. It is an integrated feature with EDM Geometry and works for all types of EDM Modal testing and analysis.
The ODS in the time domain animates the deformation which consists of all the modes of the structure. In this article, the frequency domain ODS is discussed where the modes are uncoupled.

Figure 1. Frequency Domain ODS
For this experiment, a plexiglass plate is supported using bungee cords to imitate free-free boundary conditions. A mesh configuration is created on the plate and the corresponding geometry model of the test structure is generated using EDM Modal software. Modal shakers are used to excite the plate and the response is captured from uni-axial accelerometers that are roved through all the measurement points on the mesh.
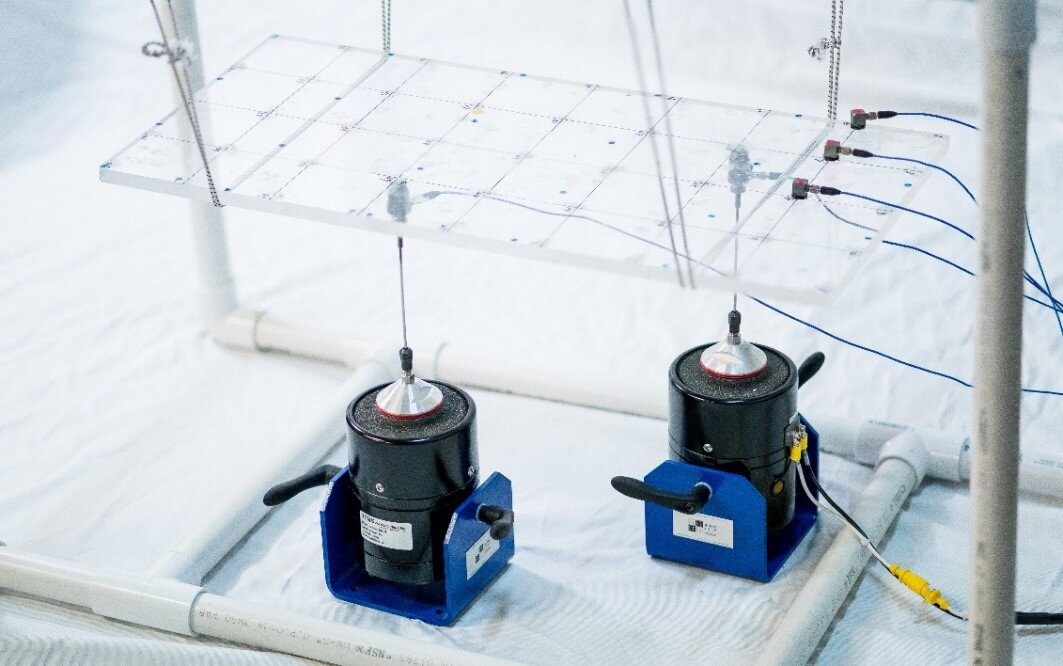
Figure 2. Modal shaker testing of plexiglass plate
A sampling rate of 1.28 kHz is implemented for this modal test. A block size of 4096 is selected. A fine frequency resolution of 0.3125 Hz is produced with these configuration settings. Measurements of higher accuracy and reduced noise are obtained by linearly averaging 28 blocks of data at each measurement DOF.
Burst random excitation imparts energy across a broad frequency range of 576 Hz and has the added advantage of user tunable burst percentage to control the no output duration time which allows the responses to decay to zero. With this setup, there will be no leakage. The uniform window can be selected. For this test, the output amplitude was set to 0.2 V with an 80% burst rate.
After the execution of the modal shaker test, the FRFs from different runs are processed to review the ODS data. The database structure of EDM allows users to easily navigate and select data. The selected data set can be animated using the geometry model. Users can save the vibration pattern in the time domain or frequency domain to .avi or .gif video files. The deformation at any particular instant can be saved to an image file.
The Source type can be selected based on the test data set. Typically, it can be Time, FRF, or another valid spectrum type such as CPS for an Operational Modal Analysis (OMA) test. The following screenshot illustrates the FRF ODS animation. The cursor can be moved using the mouse to the desired location, such as frequency in this case.

Figure 3. FRF ODS
Users can click the play button located on top of the signal graph to start the ODS animation. Clicking it again will pause the animation. The forward and backward button will move forward or backward to a point of data. The stop button will return the current cursor to the beginning. In addition to the geometry display buttons, the amplitude increase and decrease buttons are also available.
Operations like dwelling at a particular frequency, sweeping in the backward direction, different sweep speeds (slider bar), different animation speeds (slider bar) and normalization mode are available. Normalization mode allows users to observe an amplified motion of the ODS at a lower amplitude of FRF at frequencies other than natural frequencies. This feature provides a clear view of the transition between the modes of the structure. Users can edit the horizontal and vertical axis to change the display styles, axis scale, etc. The text at the bottom left alerts the user when the sweeping cursor is approaching and exiting a mode.
The following GIFs displays the ODS of the plexiglass plate when the rigid body modes are reviewed (Figure 4) and when the first two flexible body modes are studied (Figure 5). These GIFs help users understand how the first bending mode gradually transitions into the torsion mode.
Figure 4. Rigid Body Mode ODS

Figure 5. Flexible Body Mode ODS