Multi-Resolution Spectrum Analysis and Sine-on-Random Testing
Overview
In this blog post, we will discuss the benefits of using Multi-Resolution, a feature available in Vibration Control Systems, to offer a better frequency resolution in the lower frequencies of the Sine-on-Random vibration spectrum. The same benefits are also applied to the general Random test, and Random-on-Random mixed mode test.
The Sine-on-Random (SoR) test is a combined form of testing where one or multiple sine tones are excited on top of a random broadband spectrum. The SoR test is a type of Mixed Mode Random test, in addition to the Random-on-Random (RoR) vibration test which excites one or more random narrowbands on top of a broadband profile.
Figure 1. Idealized representation of a Sine-on-Random spectrum
Constant Delta F but Logarithmic Frequency Axis
The Fast Fourier Transform method used to calculate the spectrum returns a spectrum spacing each frequency point evenly apart, where the space between each frequency line is known as the Frequency Resolution, or Δf. However, it is conventional to display and analyze the spectrum logarithmically along the frequency x-axis. This results in the relative spacing looking wider in the lower frequencies and finer in the higher frequencies, as shown in the figures below.
Figure 2. Comparison of the same spectrum profile (Amplitude vs. Frequency) in Log and Linear
The figures above depict the same trapezoidal “navmat” profile being displayed first in log, and then in linear. Indeed, the application of a constant frequency resolution to a logarithmic x-axis results in a perceived deterioration of resolution in the lower left-hand side of the frequency spectrum.
It follows that in a practical vibration test setting, controlling the signal at lower frequencies will become problematic due to the poorer relative frequency resolution:
Figure 3. Display of control matching profile with noise in Log and Linear
The traditional approach: using a larger block size
Usually, an insufficient frequency resolution is addressed by increasing the block size when processing the data. Mathematically, the block size (number of lines), frequency range, and Δf are related according to the following equation:
Frequency Range = Block Size x Δf
Since the sampling rate, and therefore range of frequencies, is constant, the density of frequency lines and therefore frequency resolution will be finer.
Thus, increasing the block size is the most direct way to improve the Δf.
Figure 4. Smaller block size results in poorer frequency resolution
Figure 5. Larger block size results in finer frequency resolution
The downside to increasing the block size is that the block size will also increase by the same factor, resulting in a slower control loop for processing incoming FFT spectrums. This leaves less time for the controller to react to potential aborts or issues, increasing the security liability.
For instance, a block size of 400 lines and sampling rate of 5120 Hz will result in a Δf of 5.0 Hz and block time of 0.2 seconds. Increasing that block size by 4x to 1600 lines with the same sampling rate will give you a finer Δf of 1.25 Hz, but a correspondingly 4x slower block size of 0.8 seconds.
A new approach: Multi-Resolution
In order to tackle this block size problem from a different angle, a new technique known as Multi-Resolution was developed. Multi-Resolution essentially splits the control spectrum into two parallel control loops: one primary control loop with the original block size, and a secondary control loop with an 8x larger block size dedicated for the lower frequency portion of the spectrum.
Figure 6. Simplified diagram of parallel control loops for Multi-Resolution
In short, the primary control loop responds to alarm / abort scenarios in a timely manner, while the secondary control loop displays and controls the lower frequencies of the spectrum with a finer frequency resolution. Multi-Resolution provides the best of both worlds between control response time and frequency resolution.
Application: Sine-on-Random
Referring to the Sine-on-Random application, one common issue with a poor frequency resolution in the lower frequencies concerns the display of low-frequency sine tones. If a sine tone is located at, say, 5.0 Hz, the peak will be difficult to perceive if the frequency resolution itself is inadequate. Alternatively, it can be difficult to differentiate between two neighboring tones at similar frequencies if the gap between them is on the same order as the frequency resolution itself.
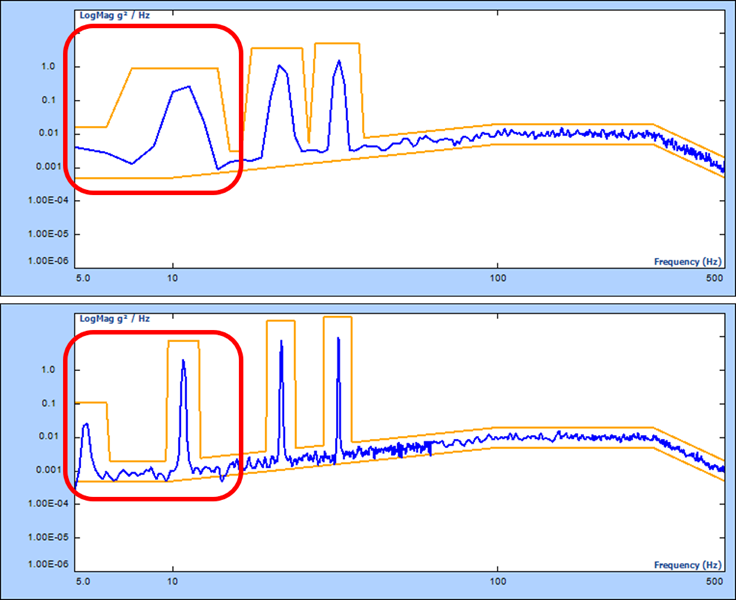
Consider the following MIL-STD-810H Sine-on-Random example, with sine tones at: 5.4, 10.8, 21.6, and 32.4 Hz:
Block size: 1024 points / 400 lines
Sampling Rate: 1.24 kHz
Frequency range: up to 500 Hz
Block time: 0.8 s
Frequency resolution Δf:
Without MR (top): 1.25 Hz
With MR (bottom): 1.25 Hz / 8 = 0.156 Hz
Figure 7. Comparison of Sine-on-Random control with and without Multi-Resolution
The top figure depicts the control performance without Multi-Resolution. The two Sine tones at 5.4 Hz and 10.8 Hz are difficult to tell apart because the relative frequency resolution of 1.25 Hz is too wide to differentiate between the energy from each tone. Only when the resolution is increased more, as shown in the Multi-Resolution figure below (MR Δf = 0.156 Hz) can the two tones be clearly distinguished.
Conclusion
Multi-Resolution is an innovative feature developed to address the tradeoff between finer frequency resolution and faster control loop times. It takes advantage of the insight that good frequency resolution is mostly needed for the lower frequencies and introduces a secondary parallel control loop specifically for handling the lower frequencies with an 8x larger block size and 8x better frequency resolution.
In this article we discuss how it can help with the Random family of tests such as Sine-on-Random, where the sine tones in the lower frequencies are better resolved using Multi-Resolution as an alternative to simply increasing the entire block size. As a result, the vibration test can still preserve a competitive primary alarm / abort reaction time while resolving the lower frequency tones.


