
Multi-Resolution Function For Random Vibration Testing
An Innovative Approach to Improve the Control Accuracy in the Low Frequency Range
Read & download Multi-Resolution Spectrum Analysis white paper.
Multi-resolution for Random Vibration Testing
Many characteristics of mechanical systems are better described logarithmically in the frequency domain. In vibration tests, uniform frequency resolution that FFT offers is not ideal because the resolution is enough in the high-frequency range may be not enough in the low frequency and the control performance is impacted.
For example, many popular Random test standards require a profile up to 2 kHz and high resolution in the low-frequency range. To meet the requirement, high resolution (large block size) that is not needed in high frequency must be used. Therefore, loop time and storage space increase and spectrum refresh rate decrease in the high-frequency range.
To increase the control performance in the low-frequency range and maintain reasonable loop time, different resolutions should be applied to the low and high-frequency range in the entire control process.
EDM provides the multi-resolution feature that applies the selected resolution in the high-frequency range and 8 times of the resolution in the low-frequency range. The cutoff frequency, which divides the low and high-frequency range, is calculated by the software. A few adjacent frequencies can also be selected by the user to avoid system resonance or anti-resonance.
Control Algorithms
In the implementation, two different control loops with different sampling rates are used. Suppose that the sampling rate in the control system is Fs, we divide the whole frequency range into two bands: (0, Fs/20] and (Fs/20, Fh). DeltaF is the resolution in frequency band (Fs/20, Fh), then we use DeltaF/8 as the resolution in (0,Fs/20]. Down sampling 8 is used in the algorithm. Fig.2 shows us the multi-resolution control method to be used.
Figure 2: Two bands Multi-resolution Random Vibration Control - click to enlarge.
The output peak detection and modification also remain unchanged. In the CalOutput( ) function, we just add data from different bands, and send the result to the following detection and modification model, just as what in the now using system.
The user defined profile shall be decomposed into 2 bands in the initializing period, to get the low band reference profile. The Spider will operate on these two profiles simultaneously.
Figure 3: Profile divide into two bands
Testing Comparison
In the composite window below, a test is running without multi-resolution control at 400 lines.
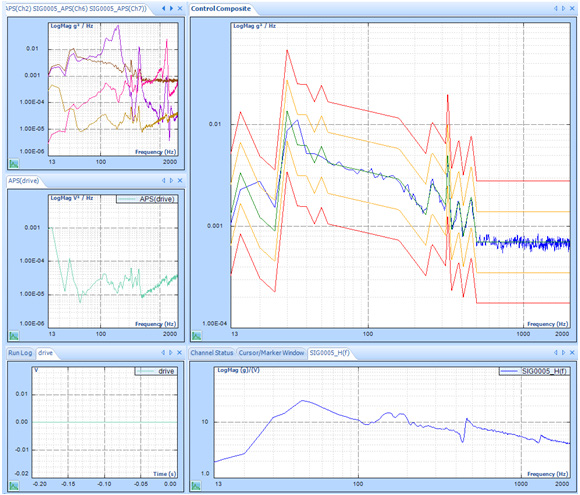
The blue line is the control spectrum. The green line is the profile spectrum. Yellow and red lines are alarm and abort limits.
In this case, a Spider is running a Random test with a profile where there are a few peaks and valleys below 100 Hz and between 200 to 500 Hz. We can see that control spectrum matches the profile very well between 200 to 500 Hz, but not satisfactory below 100 Hz. The reason is described in the first paragraph of this article.
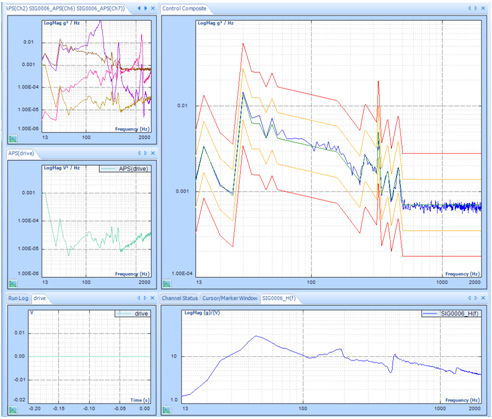
With multi-resolution control enabled, the resolution in the low-frequency range is much higher and the control performance is greatly improved. The control spectrum matches the profile below 100 Hz as well as 200 to 500 Hz.
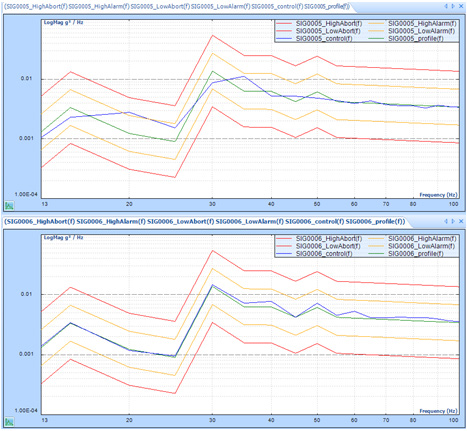
By zooming to 13~100 Hz range in the control composite window in both cases.
The top chart shows how control(f) matches profile(f) WITHOUT multi-resolution control.
The bottom chart shows how control(f) matches profile(f) WITH multi-resolution control.
Control(f) matches profile(f) better with the multi-resolution control.
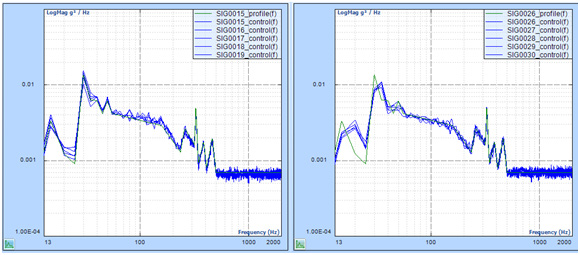
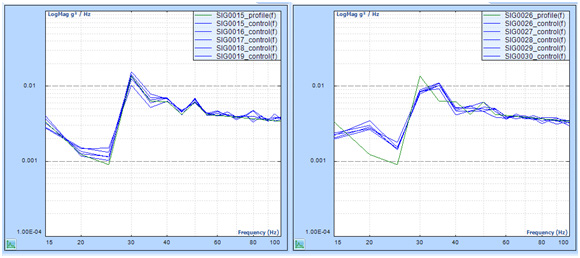
Here are more test results for comparison: (line = 400, Fa = 2000 Hz, deltaF = 5 Hz)
Signals in the left chart are saved in a Random test WITH multi-resolution.
Signals in the right chart are saved in a Random test WITHOUT multi-resolution.
Both charts show the frequency range of 10 Hz to 2000 Hz.
Zoom to 15 to 100 Hz range
The following tables show the deviation in decibels between the control(f) and profile(f) (|Control(f)-Profile(f)|) at each FFT bin frequency.
| Signal Name: | SIG0015 | SIG0016 | SIG0017 | SIG0018 | SIG0019 | ||
|---|---|---|---|---|---|---|---|
| Freq (Hz) | profile (f) (dB) | | Control (f)-Profile(f) | (dB) |
Average | Control (f)-Profile (f) | (dB) | ||||
| 15.0 | -24.75 | 0.82 | 0.70 | 0.13 | 0.43 | 0.82 | 0.58 |
| 20.0 | -29.10 | 0.77 | 0.91 | 0.41 | 0.10 | 0.21 | 0.48 |
| 25.0 | -30.46 | 2.21 | 1.64 | 1.02 | 1.08 | 0.57 | 1.31 |
| 30.0 | -18.63 | 1.25 | 0.15 | 0.07 | 0.41 | 0.57 | 0.49 |
| 35.0 | -22.02 | 0.82 | 0.51 | 0.21 | 0.19 | 0.99 | 0.54 |
| 40.0 | -22.05 | 0.05 | 0.49 | 0.47 | 0.52 | 0.36 | 0.38 |
| 45.0 | -23.77 | 0.58 | 0.37 | 0.06 | 0.30 | 0.45 | 0.35 |
| 50.0 | -22.14 | 0.10 | 0.32 | 0.55 | 0.46 | 0.06 | 0.30 |
| 55.0 | -23.77 | 0.14 | 0.05 | 0.02 | 0.09 | 0.21 | 0.10 |
| 60.0 | -23.90 | 0.62 | 0.51 | 0.25 | 0.02 | 0.04 | 0.29 |
| 65.0 | -24.02 | 0.09 | 0.21 | 0.25 | 0.59 | 0.26 | 0.28 |
| 70.0 | -24.14 | 0.15 | 0.35 | 0.07 | 0.00 | 0.01 | 0.12 |
| 75.0 | -24.24 | 0.39 | 0.35 | 0.36 | 0.22 | 0.22 | 0.31 |
| 80.0 | -24.34 | 0.46 | 0.19 | 1.11 | 1.08 | 0.34 | 0.64 |
| 85.0 | -24.43 | 0.38 | 0.54 | 0.49 | 0.11 | 0.10 | 0.32 |
| 90.0 | -24.52 | 0.14 | 0.16 | 0.16 | 0.11 | 0.13 | 0.14 |
| 95.0 | -24.60 | 0.06 | 0.31 | 0.27 | 0.94 | 0.46 | 0.41 |
| 100.0 | -24.68 | 0.26 | 0.56 | 0.51 | 0.29 | 0.37 | 0.40 |
| Signal Name: | SIG0026 | SIG0027 | SIG0028 | SIG0029 | SIG0030 | ||
|---|---|---|---|---|---|---|---|
| Freq (Hz) | profile (f) (dB) | | Control (f)-Profile (f) | (dB) |
Average | Control (f)-Profile (f) | (dB) | ||||
| 15.0 | -24.75 | 1.72 | 2.30 | 2.15 | 1.82 | 1.51 | 1.90 |
| 20.0 | -29.10 | 3.44 | 3.33 | 3.68 | 4.50 | 3.89 | 3.77 |
| 25.0 | -30.46 | 2.98 | 2.14 | 2.13 | 2.32 | 1.97 | 2.31 |
| 30.0 | -18.63 | 1.86 | 2.03 | 2.14 | 2.39 | 2.10 | 2.10 |
| 35.0 | -22.02 | 2.47 | 1.67 | 2.12 | 2.13 | 2.38 | 2.16 |
| 40.0 | -22.05 | 0.79 | 1.79 | 0.93 | 1.24 | 1.16 | 1.18 |
| 45.0 | -23.77 | 0.81 | 0.50 | 1.14 | 0.39 | 1.09 | 0.78 |
| 50.0 | -22.14 | 0.91 | 1.22 | 1.24 | 0.63 | 0.04 | 0.81 |
| 55.0 | -23.77 | 0.66 | 0.77 | 0.37 | 0.79 | 0.38 | 0.59 |
| 60.0 | -23.90 | 0.53 | 0.14 | 0.37 | 0.21 | 0.37 | 0.32 |
| 65.0 | -24.02 | 0.33 | 0.32 | 0.12 | 0.08 | 0.01 | 0.17 |
| 70.0 | -24.14 | 0.08 | 0.02 | 0.24 | 0.06 | 0.17 | 0.12 |
| 75.0 | -24.24 | 0.24 | 0.08 | 0.07 | 0.30 | 0.11 | 0.16 |
| 80.0 | -24.34 | 0.13 | 0.65 | 0.31 | 0.02 | 0.05 | 0.23 |
| 85.0 | -24.43 | 0.27 | 0.15 | 0.05 | 0.09 | 0.26 | 0.17 |
| 90.0 | -24.52 | 0.32 | 0.04 | 0.21 | 0.12 | 0.54 | 0.25 |
| 95.0 | -24.60 | 0.06 | 0.30 | 0.14 | 0.01 | 0.27 | 0.16 |
| 100.0 | -24.68 | 0.21 | 0.12 | 0.05 | 0.15 | 0.63 | 0.23 |
Plot averaged difference of 5 signals at each frequency in both cases.
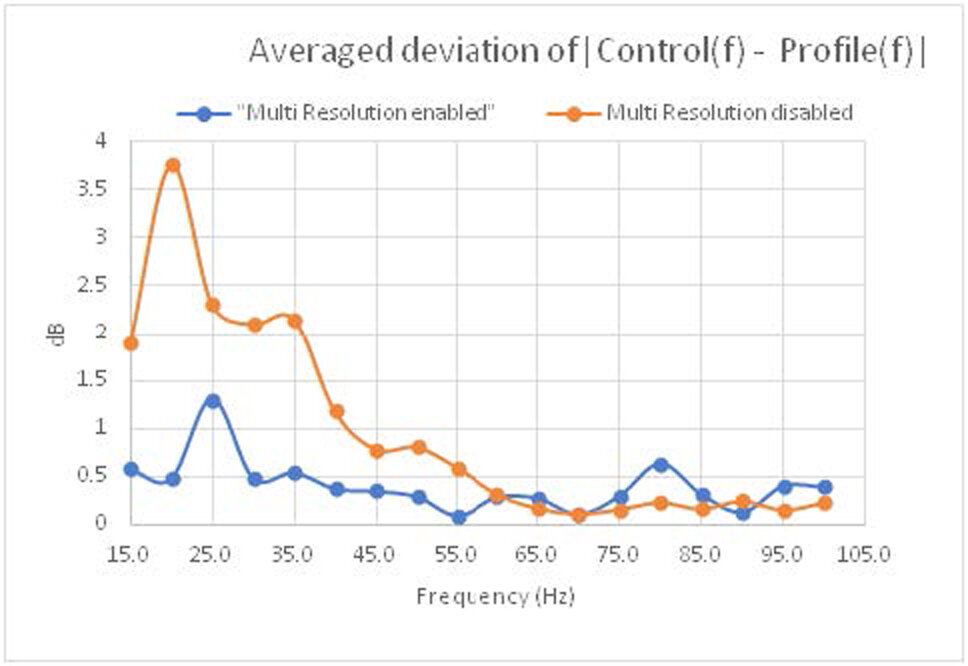
Conclusion: the difference between control(f) and profile(f) is much more minimized in the low-frequency range with multi-resolution control.