
Micro-vibration Measurements with CoCo-80X
Download Paper
Micro-vibrations are vibrations that are too small for human detection but are measured by high accuracy instruments. More specifically, micro-vibration is defined as vibration detected between 1~100 Hz with an amplitude smaller than 50 μm/s.

Due to the development of semiconductors, the gate length has decreased and the shortest length provided is from TSMC at a length of 5 nm. In the manufacturing process, many high accuracy instruments are used and are impacted with micro-vibrations. If these are not properly controlled, the yield rate of the wafer is drastically decreased.
Sources of micro-vibration can originate from inside or outside the IC factory. External sources of micro-vibrations includes trains, subways, automobile traffic, airplane flights, factory operations, and construction work. It is important to select a location without many external vibrations prior to constructing an IC factory. The building materials and structural plans are taken into consideration during the construction of an IC factory to minimize micro-vibrations within the interior.

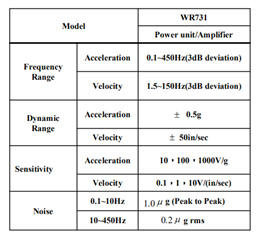
The accurate measurement of micro-vibrations is the first step of successful vibration contamination control. According to generic vibration criteria for vibration sensitive equipment, the RMS velocity of vibration criterion is from 50 to 3.1 μm/s (2000 to 125 μin/s). To measure such small amplitudes, high sensitivity and low frequency sensors must be used. Crystal Instruments provides the Wilcoxon WR 731 and PCB 393B31 accelerometers with the CoCo-80X data analyzer for this application.


Compared to traditional analyzers, the CoCo-80X is a superior analyzer for micro-vibration measurement. It does not require a computer to acquire data and is not considered a computer. The CoCo-80X is a portable system that does not require the tedious checks usually performed on every computer brought into an IC factory. The CoCo-80X acquires data and provides real-time analysis on-site. Afterwards, users can process data using Crystal Instruments Post Analysis software for further analysis.

Performing Micro-vibration Measurements on the CoCo-80X
Real-time Octave Spectrum and VC Curves
Enter DSA mode in the CoCo-80X and select “Octave Analysis and Sound Level Meter”.

Micro-vibration measurements are recorded in octave spectra and are compared to VC curves.
Based on the number of input channels required, select an OCT(X) CSA. X = 2, 4, 6, 8 to indicate the number of input channels enabled.

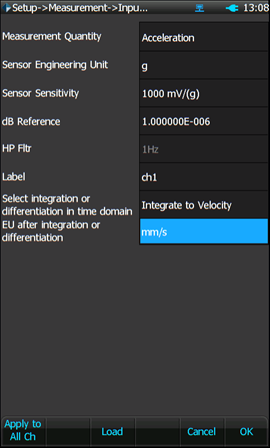
VC curves are recorded in velocity. If accelerometers are used to obtain measurements, be sure to select integration to integrate the results to velocity.
Users can add a Bar Window in the Display Windows Settings.

In the Analysis Parameters page, the octave resolution, low frequency, and high frequency must be specified according to the standard being used. Other parameters can be set according to the requirements.

After the preceding settings are configured, users can enable a VC curve under the cursor menu.

Enabled VC curves will be displayed with real-time octave spectrum for visual comparison.

Hit the save button on the CoCo to save the octave spectrum measurement.
Double-click “OCT(2)” next to the CI logo on the top left corner to save a screenshot of the CoCo.
The default display type of the 1/3 octave spectrum is a bar graph. Navigate to Display Preferences and Display Chart to set the display type as Bar or Linear.

While running OCT(X) CSA. X = 2, 4, 6, 8, hit the “Record” button on the CoCo to record time data.

Users can record time data from micro-vibrations using Transient(X) CSA. X indicates the number of input channels. Transient(x) CSA does not have a real-time analysis feature, so it offers fewer settings and a simplified interface.

When switching to another CSA, the input channel settings are not carried over. The user must load the settings from the library or set them up. If the desired quantity of time data is the same as the sensor, then no integration should be selected.

Select the desired sampling rate for recording data.

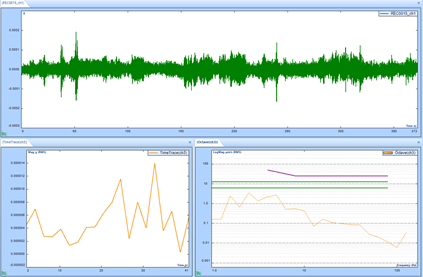
When everything is ready, the micro-vibration measurement in time domain is displayed on the screen and is not recorded yet.
Press the Record button to start and stop recording.

The recorded data can be downloaded for analysis with Crystal Instruments EDM Post Analysis (PA) software. Users can calculate the octave spectrum of time data with PA and for comparison with VC curves.