
Setting SRS Wavelet Parameters
Introduction
The SRS Synthesis test aims to create a time profile shock pulse whose Shock Response Spectrum matches a profile defined by the customer.
The Shock Response Spectrum is a plot of what would happen if you subjected a hypothetical SDOF system (single-degree-of-freedom aka mass on a spring) to that pulse
X-axis is the natural frequency of that SDOF system
Y-axis is the maximum relative acceleration reached in the SDOF response
User must also provide a damping ratio, as the SDOF response requires damping and natural frequency
For any given shock waveform, the SRS can be computed by iterating over the natural frequencies of a hypothetical SDOF system and plotting the maximum response against natural frequency. The damping ratio (e.g. 5%) must be also provided to model the SDOF system.
Going the reverse direction of synthesizing a shock waveform from a given SRS target (also known as the Required Response Spectrum or RRS), is less straightforward because there are an infinite number of possible waveforms that produce the same SRS.
First, it is noted that a pure sine wave of frequency f produces an SRS that sharply peaks in that same frequency f in the response spectrum domain. Multiple sine waves can be added together to produce a combined SRS that is essentially additive from its individual time components.
Thus, a time profile pulse can be synthesized to match a given RRS by combining multiple sine wavelets. Each wavelet is responsible for exciting the SRS value corresponding to its natural frequency, as a SDOF system responds to excitation primarily in its natural frequency.
While it is possible to use a direct sine wave, it is more common for the sine wave to be windowed to a given shape, which will also affect the shape of the final synthesized wavelet. Common windows include the Sine, Hanning and Exponential window. It is even possible to create a custom window based on a user-provided recording.
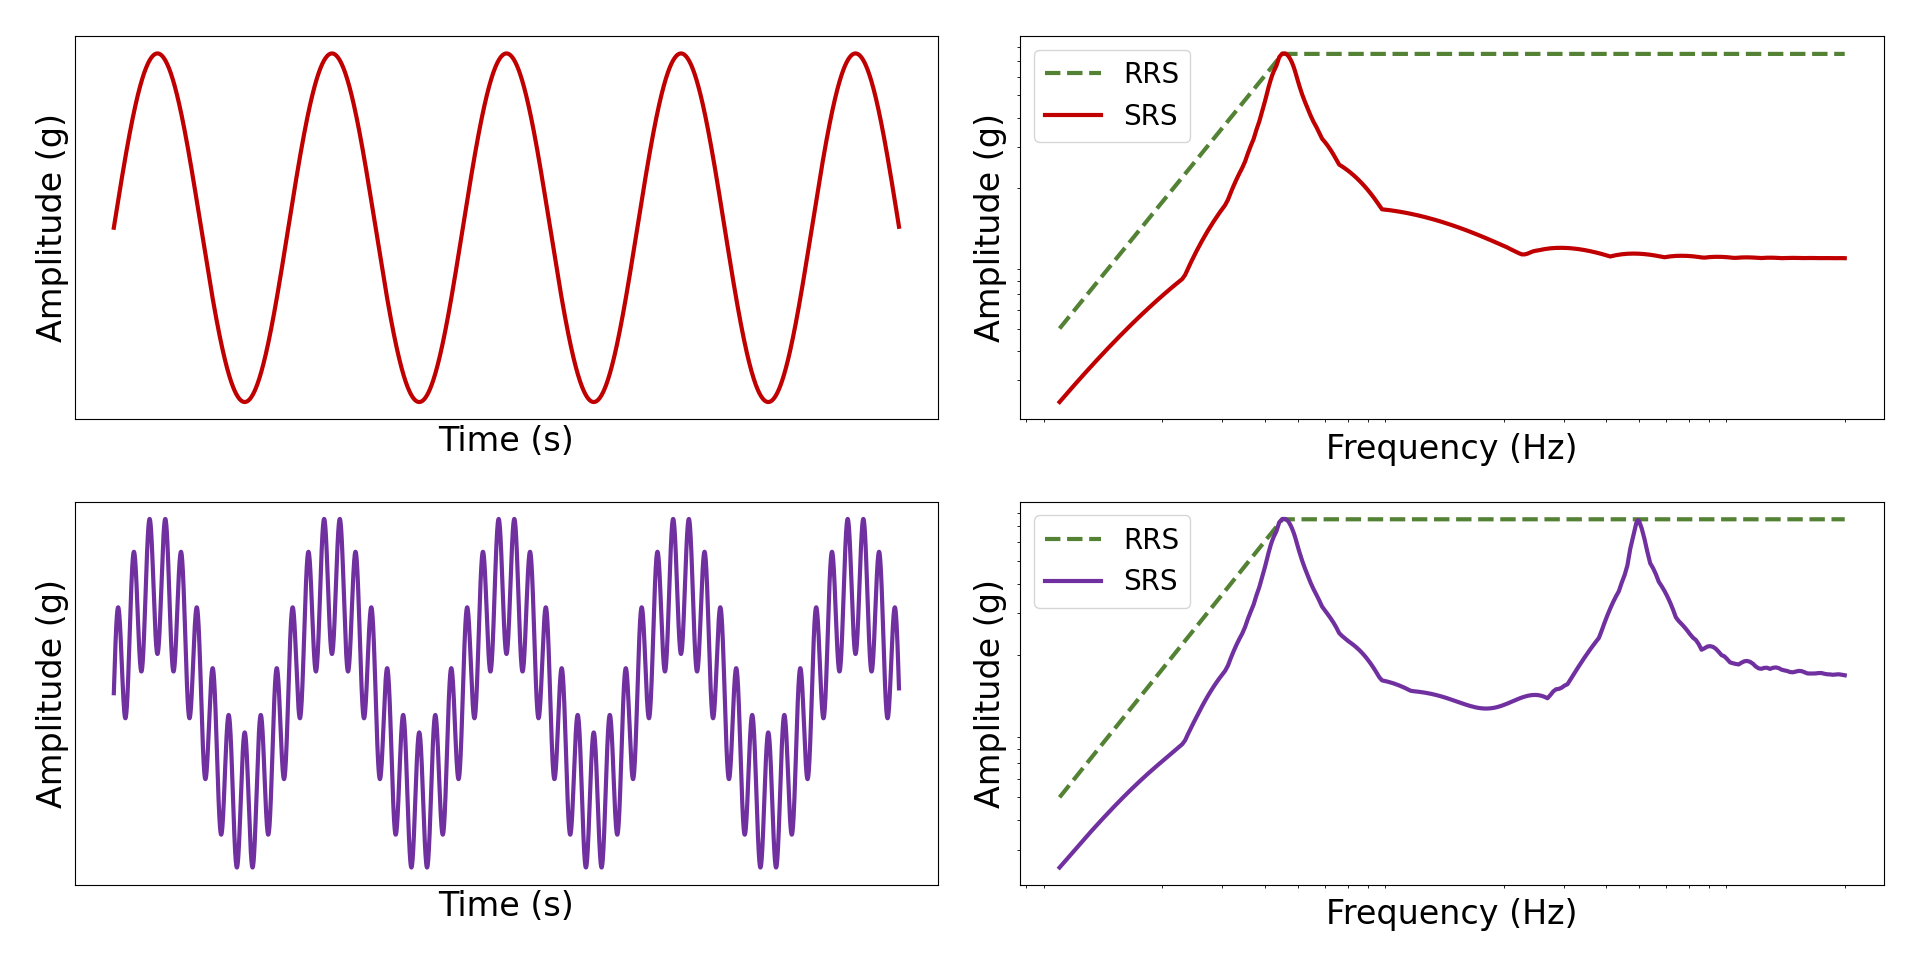
As an example, below is the formula and shape of sine wavelets using the Sine window:


The top waveform (red) in the above image is a single wavelet, whereas the waveform below is the sum of three combined sine wavelets of different frequencies. Note that all three frequencies are reflected in the resultant SRS.
Sampling rate is another important aspect of calculating accurate SRS information. The Nyquist rule says that the sampling rate should be at least twice the maximum frequency content of the measured waveform (in practice, a factor closer to 2.56 is used).
Although all of the frequency information is captured by adhering to the Nyquist rate, the actual time domain representation of the waveform is not as accurate, with a high likelihood of missing the true peaks of the signal.
The MIL-STD-810 recommends using a sampling rate that is 10x the maximum frequency of the measured waveform. This accurately captures the waveform peaks to calculate the SRS.
Alternatively, if the sampling rate meets at least the Nyquist conditions of (~2.5 f), the signal can be resampling to a higher sampling rate. As all of the frequency information was captured, the peaks can be interpolated via resampling to arbitrary degrees of precision. This can be done by either zero-interpolation and lowpass filtering in the time domain, or zero-padding in the frequency domain.

Above is an example of a sine wavelet that is sampled at the Nyquist rate (red), compared to the same signal sampled at 10x the maximum frequency (purple), and finally the same signal sampled at the Nyquist rate then resampled at a 4:1 ratio. The resulting SRS plots on the right show that either a direct 10x sampling rate or a subsequent resampling from the Nyquist ratio are sufficient to accurately capture the SRS.