
Modal Data Acquisition Using CoCo Testing Plan on CoCo-80X/90X
A brief introduction about the CoCo hardware platform is provided below.
The CoCo-80X is a handheld data recorder, dynamic signal analyzer and vibration data collector from Crystal Instruments. It has a significantly powerful processor which frees DSP resources for faster, more reliable, and more complex processing in real-time.
The handheld system is equipped with a bright 7.0-inch color LCD with multi-point touch functions as well as a physical keypad. Flexible connections are provided via a USB 2.0 port, 100Base-T Ethernet port, 802.11 b/g/n optional Wi-Fi connection, SD card interface, HDMI interface, CAN-bus/serial port, stereo headphone and microphone jack, and GPS. Connect the CoCo-80X to a PC to download files, remotely control operations, or upgrade the software through several means of network connections.

Figure 1. CoCo-80X System
The CoCo-80X is equipped with 8 software enabled input channels. A unit initially purchased as a 2 channel CoCo-80X can be remotely upgraded to 4, 6, or 8 channels with a simple purchase. Each analog input is serviced by two 24-bit ADCs and a DSP implementing the cross path calibration technology of US patent number 7,302,354 B2 to achieve a better than 150 dBFS dynamic range. Measured time histories can be recorded in 32-bit single precision floating point format and all subsequent signal processing is performed using floating-point arithmetic. 54 sample rates from 0.48 Hz to 102.4 kHz are provided with better than 150 dB of alias-free data.
The CoCo-80X hardware platform supports three different software working modes: Dynamic Signal Analyzer (DSA), Route and OnSite mode, and CoCo Real-Time (CRT) mode. Each working mode has its own user interface and navigation structure. DSA mode is designed for structure analysis and mechanical testing. It is useful for electrical measurement, acoustic analysis, and a wide range of other applications. Route and OnSite mode is dedicated to route-based machine condition monitoring, vibration data collection, and trending. CRT mode allows the instrument to be operated as a bench-top testing device to execute commands and display data in real-time on an accompanying PC.
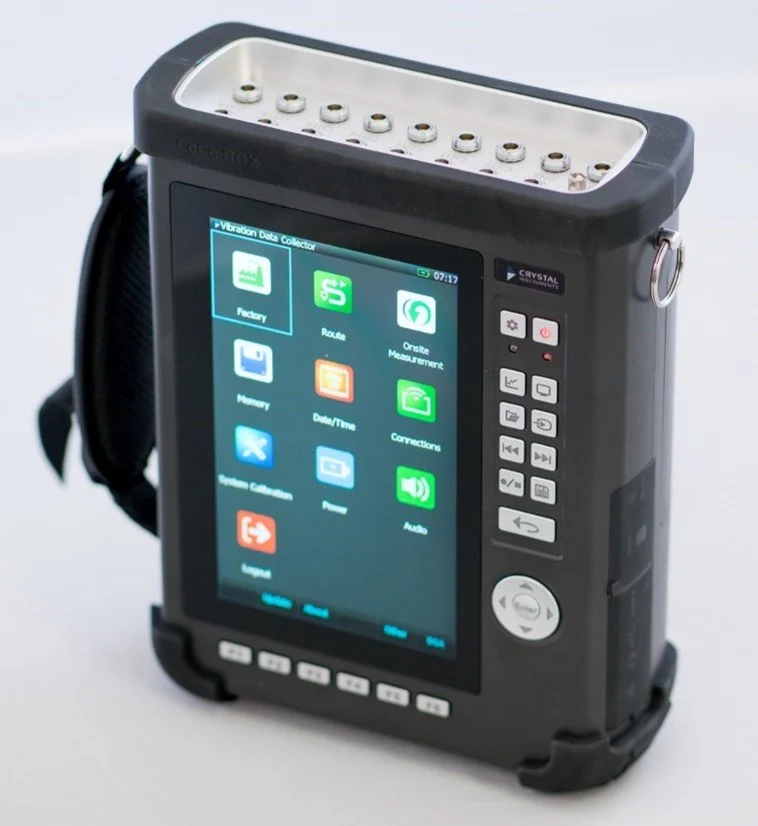
Figure 2. CoCo-90X System
The CoCo-90X is equipped with 16 input channels employing LEMO connectors. It can accurately measure and record both dynamic and static signals. The mass flash memory can simultaneously record 16 channels of streaming signals (up to 51.2 kHz) while computing real-time time and frequency based functions. An embedded signal source channel provides various signal output waveforms that are synchronized with the input sampling rate. LEMO to BNC adapters are provided.
The Modal Data Acquisition (MDA) function for the CoCo-80X/90X allows users to conveniently acquire modal data in the field. The CoCo Testing Plan provides an overview of the measurement process and also provides the ability to customize the measurement entries. Combining this with the visual display of the test specimen model makes the entire workflow efficient, intuitive, and simple. This testing plan also provides an interactive user interface which provides users the flexibility to assign geometric DOFs and signal names to data files during the middle of testing. Data files are transferred to a PC with a few mouse clicks. After the data files are generated, users can perform modal analysis with EDM Modal software. An illustration of the workflow is shown in the following diagram.

Figure 3. Workflow of modal test executed using CoCo system and EDM Modal
This article describes a step-by-step process of the CoCo MDA function along with the CoCo Testing Plan feature. A brief overview of transferring the data from the CoCo to EDM Modal in order to post-process the data is also presented.
Modal Measurements Using CoCo Testing Plan on CoCo-80X/90
When using the CoCo-80X to perform modal testing, 2, 4, 8 channel versions will support MDA. Even the 16 channel CoCo-90 will support MDA.

Figure 4. Experimental Setup Illustration
The meshing DOFs on the test specimen is created. Fixed response(s) or fixed excitation can be selected to rove through all the measurement DOFs based on the implemented roving excitation or roving response respectively.

Figure 5. Mesh grid on test structure
Then, the 3D geometric model of the test specimen is created in EDM Modal.

Figure 6. 3D geometric model created in EDM modal
Next, the input channel settings are established to configure the excitation and response channels in EDM Modal.

Figure 7. Input channel setup in EDM Modal
A testing plan is automatically generated in EDM Modal using the geometry model, input channel settings and selected roving mode (roving excitation or roving response).

Figure 8. Testing plan generated in EDM Modal
This testing plan is exported to save the testing plan and geometry information of the modal test.

Figure 9. Testing plan exported from EDM Modal
The two .xml files of the testing plan and geometry are saved onto an SD card. A folder labeled MDA (Modal Data Acquisition) is created and the two .xml files are saved in that location for further transferring onto the CoCo. The SD card is plugged into the CoCo hardware system.

Figure 10. Testing Plan & Geometry loaded onto SD card
When the CoCo is turned on, the user has the following options to choose from at the start up screen.

Figure 11. CoCo system start-up screen
After the Dynamic Signal Analyzer (DSA) mode is chosen, the user reaches a recent projects screen. For a first time measurement, the user clicks on the “Analysis” option (F2 Hard Key on the CoCo) to reach the various CSA’s available in DSA mode.

Figure 12. CoCo DSA Recent Projects screen
The appropriate CSA in the Application group is selected. The Modal Data Acquisition (MDA) CSA is chosen to execute the modal test on the CoCo as shown in the following screenshot.

Figure 13. CoCo DSA Analysis Groups
The CoCo Testing Plan on the SD card will be available automatically after clicking on the MDA option.

Figure 14. CoCo Test Plan in MDA Test
The user can click on “OK” to move onto the next step which shows the measurement entry list. This list is the testing plan that is generated in EDM Modal from the 3D geometry model, input channel and the roving mode information.

Figure 15. Measurement Entry List in CoCo Testing Plan
The user can click on “Entry Details” (or the F1 hard key on the CoCo) to view details of the selected measurement entry. These details indicate the excitation and response channels along with the measurement DOFs.
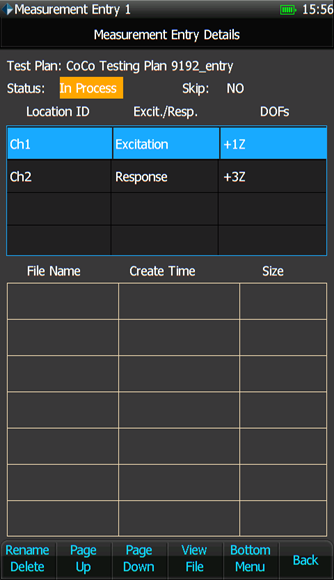
Figure 16. Edit Measurement Entry
The user can choose to rename or delete a particular measurement entry by clicking on F1. Various other options like “Page Up”, “Page Down”, “View File”, “Bottom Menu”, and “Back” are also available.
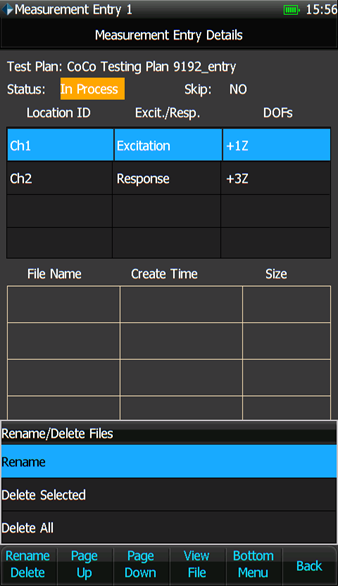
Figure 17. File Changes in Measurement Entry
After implementing any necessary changes, the user can click on the “Back” option and return to the previous menu.

Figure 18. Modifications to Measurement Entry List in CoCo Testing Plan
On this main page, the user can click on F2 or the Meas. Channels option to view the modified measurement channels.

Figure 19. Measurement Channel Display in CoCo Testing Plan
If any further modifications or changes are required, the previous step of customizing Entry Details can be repeated. On clicking “Back” and returning to the main menu of the measurement entries list, the user can click on the “Activate” button to begin the test measurement for the selected/highlighted measurement entry.


Figure 20. Execute MDA test with CoCo Testing Plan
The test is now created. The upcoming section discusses how to set up and configure the different test parameters before executing a modal test on the CoCo.
Setting Up the Parameters
Input Channels
To set up the input channels, select the Input Channels item under Param. Key (F2), then set the appropriate sensitivity for the different channels (excitation and response).


Figure 21. Input Channel Setup on CoCo
For example, if Channel 1 is connected to the impact hammer, the sensitivity should be set to mV/Newton. Also, Channel 2 is connected to accelerometers with IEPE power enabled.
Analysis Frequency Range
The user selects the appropriate frequency range according to the interested number of modes of the test specimen.


Analysis Parameters
Select the Analysis Parameters under the Param. (F2) key.


Select the appropriate block size, average mode, and average number. For impact hammer testing, the user usually selects the Uniform or Force-Exponential windows.
Set-up Trigger
Select the Trigger Setup under Params. (F2) button.
For the impact hammer test, set the following:
Trigger Mode: Manual Arm Trigger
Trigger Source: channel 1
Trigger Condition: Ch1>High Level (rising edge)
Trigger Delay: roughly 5%
Trigger Level: adjust to roughly half the peak value of Ch1


Figure 25. Trigger Settings on CoCo
Execute the MDA Test
Now that all the parameters are set, the actual modal test can begin. If the CoCo is in HOLD mode, press F6 to run the test. A trigger source window will appear while waiting for the trigger.
Below are some screenshots showing the control commands for this process:


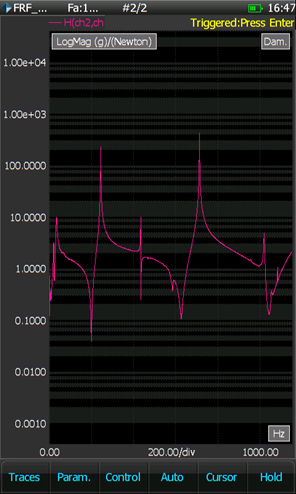
Users can observe the different signal qualities during the measurements. The user can choose to accept or reject the associated measurements to continuously average the signals until the average number is reached.
Clicking on Traces (F1) allows the user to view different Time, APS, CPS, FRF & COH signals.


Users can restart the measurement under control key (F3).

Users can also return to the entry list in the CoCo Testing Plan by clicking on the “Measurement Entry List” option to decide the next step of the modal test.


Users can click on the “Change Save Export” option to change the signals to be saved during a test.


Users can click on the “Next Entry” option to proceed to the next entry and the next measurement trigger window will appear.


View Files on CoCo
Users can view saved data files during testing or upon completion. Press the File button on the CoCo to view saved files and signals.


Download Files to PC
After all measurements are taken, the saved files are now transferred from the Coco to the computer. This can be done through WiFi or by connecting an Ethernet cable. An SD card also works. The EDM Coco-DSA software converts the measurement signals from .rec format to. atfx and .dat format (ASAM-ODS standard format) which can be imported into EDM Modal software for modal parameters estimation.

Modal Analysis
EDM Modal is complete modal analysis tool used for modal testing and analysis. The software design is based on the process. The main tabs are arranged intuitively based on the operation sequence, from left to right.
New Test with Data Files Selected
Create a new “Import FRF Data” test using EDM Modal. Select the modal data by browsing to the .atfx files (paired with .dat files), saved to the PC in the previous step.

Modal Data Selection
Users can import converted signals into the modal software and open them in modal data selection to overlap the real and imaginary part of FRF signals for all measurement points.

The FRF signals from each measurement can be displayed individually or together. The current corresponding response point will be highlighted on the geometry model as a red dot.
Band Selection
The band selection has a choice of different types of MIF functions and the FRF sum. They are used to indicate the location of modes (i.e., natural frequencies).
The main purpose of the band selection tab is to set the frequency band for modal parameter identification. Users can set the start and end frequency of the analysis band using the band window or enter values into the text boxes.

Stability Diagram
The stability diagram displays the number of poles drawn with the mode order increasing from 1 to the max order. After the modal order is decided, different estimators such as Time Domain or Poly-X can be used to identify the modal parameters. The stable poles are illustrated with the green + sign. The stable pole along with a fixed frequency can be selected and used for the next mode shape data fitting.

Click on “Calculate Mode” with all stable poles selected to open the “Mode Shape Save Option” window as shown in the following screenshot.

The coming mode shape can be saved to a new shape data file or saved to an existing shape data file. In general, the modal analysis process is accomplished through multiple bands, and the mode data can be saved to an existing shape data file. This will result in one shape data file containing all the mode data over the complete frequency range.
Animation
With the mode saved in the previous stage, EDM Modal software moves onto the Animation tab. The top left panel illustrates the MAC matrix data of the current shape file.
The Modal Assurance Criterion (MAC) assists in validating measurements. The Auto-MAC matrix shows that the modes are uniquely identified. The matrix has high diagonal elements showing the modes are only orthogonal to itself.

Figure 42. Auto-MAC Chart
The modal parameters section indicates the natural frequency and damping of each mode. Once a mode is selected for animation, the mode shape data of the selected mode is listed in the lower left panel.
The animation provides visualizations of different mode shapes. Various features such as node lines, smoothing etc. assist in improving the animation of different shapes.

Figure 43. Animation Tab
The mode shape animation can be set to different speeds and amplitudes using the animation control icons. Different geometry display features can provide visual effects of the animation.
Combining the powerful CoCo hardware system with the solid performance of EDM Modal software provides users with a seamless integration of the modal analysis process.