
Visualizing the Orbit Trace of a Three-axis Shaker
This article describes the orbit plot feature in the vibration visualization function. In-depth details about the workflow of the vibration visualization process will be discussed in the later portion of the article. The orbit plot is not only used to understand the magnitude of the vibration during a vibration test but also to observe the phase relationship between the different channels used to acquire the response of the unit under test. This is understood more clearly using a test case.
A tri-axial accelerometer was mounted on a three-axis shaker system. A Multiple-Input Multiple-Output (MIMO) sine sweep vibration control test was executed with different profiles assigned to the x, y and z axis. However, the amplitude of the vibration profiles remained the same for all the axes. To observe the orbit plot feature, the x, y and z axes profile were assigned a 0, 60 and 120-degree phase difference respectively.
Figure 1 - Three-Axis Shaker System
A single measurement point is modelled on the shaker table and is chosen to animate the vibration data collected using the tri-axial accelerometer. The orbit plot shows the measurement point traces an inclined circle while experiencing the 3-axis MIMO sine vibration. When examining the traced circle, users can observe that when the x-axis vibration is at its peak, the y and z axes are half the amplitudes and also opposite in direction. Similarly, when the y-axis vibration is peaked, the x and z axes vibration are at 50% value of the peak and vibrating in the opposite directions. Hence, the circle represents the phase relationship between the channels in a simple and efficient manner. Furthermore, the vibration amplitudes are the same for the three profiles which results in a circular trace. If the amplitudes were tweaked to be different, this circle would be elongated in the particular direction to trace an ellipse. It can also be noted that since there is a 3rd axis vibration profile assigned to the z-direction, the circle is not flat but rather inclined. If the same experiment was executed using only the x and y axes, then the circle would be traced in the 2D plane of x-y. The 3D orbit plot is also shown in each of the 2D planes of x-y, y-z and x-z to show the individual contributions through the traced shadows. Users can study the vibration information of the channels in the time traces shown below. However, using a model to animate this information simplifies the visualization for interpretation. This feature is available in EDM Modal, VCS and DSA software.
Figure 2 - Orbit Plot display in 3-axis MIMO Sine VCS test
This section of the article provides a general overview of the vibration visualization process. It is difficult to imagine the actual vibration level and distribution from a numerical display or signals, which are basically a mathematical representation of the vibration experienced by the structure under test. Animating the structure’s deformation produces a superior representation of the vibration intensity. A contour scale which graphically displays the magnitude of vibration on the structure using a color plot provides visualization of areas the test unit is experiencing maximum and minimum magnitude from vibrations. As discussed above, the orbit plot feature helps users to understand the magnitude and phase relationship between the different channels as well. This portion of the article briefly describes the need and workflow of the vibration visualization process.
A 3D geometry model of the structure under test is required to animate the vibration it is experiencing. It is difficult to create a 3D model of intricate geometries because of the complexity involved in measuring the x, y, z coordinates of the test article and to use this information to generate a model with lines and surfaces.
The vibration visualization approach provided by Crystal Instruments not only overcomes the difficulty of producing 3D geometries from any complicated models with a simple procedure but also animates the structure’s deformation which makes it possible to visualize the vibration experienced by the testing article during a vibration test. Click here to read more details about this 3D reconstruction method.
Figure 3 - Vibration Visualization using 3D reconstructed model
The vibration visualization of the 3D model can be performed in real-time while the measurement is going on or offline, after the measurement is completed. The real-time animation can use point, block, or RMS data of the input channels (sensors) to display the deformation of the test article during the vibration test. The time data captured using the sensors can also be used to display the orbit plot which is discussed in more detail in the upcoming section. The offline vibration data can be visualized in the time domain as well as the frequency domain. The time domain animation can show the combined effect of all the modes whereas the frequency domain animation uncouples the modes and shows the effect of the vibration mode at the respective frequency. The offline time domain data can also be used to visualize the magnitude and phase relationship for the different channels using the orbit plot.
The flowchart below illustrates the different methods of generating a three-dimensional geometry model of a structure under test to animate and visualize the structure’s vibration in real-time and offline mode.
Figure 4 - Schematic flowchart of the vibration visualization process
To obtain more information regarding online ODS to visualize decimated time stream signals, captured block signals, or RMS values from these signals, please visit the following links:
Figure 5 - Online Visualization feature in a single-axis Random Vibration Control test executed in EDM-VCS
Figure 6 - Online Visualization feature in a FFT test executed in EDM-DSA
The links above explain the process and working of the online visualization feature using the different options provided in EDM-VCS and EDM-DSA software. The configuration settings, test setup and other details about the experimentation are also discussed.
Vibration visualization is not only useful in real time (Online ODS) where a user can see the instantaneous deformation of the structure but is also helpful after the completion of measurements. Users can analyze and visualize the measured data to observe the test structure’s vibration in both time and frequency domain.
Click here to learn about the offline visualization feature provided in EDM Modal software and its experimental setup and test details.
Figure 7 - Offline Visualization feature in an experimental modal test executed with EDM Modal
The highlighted approach was used to model and demonstrate the orbit plot functionality of the vibration visualization procedure.
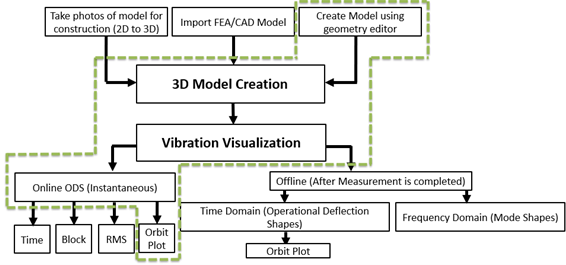
Figure 8 - Orbit Plot in Vibration Visualization
To learn more, please visit https://www.crystalinstruments.com/