
EDM Modal Playback Analysis
Experimental modal analysis often takes place inside a lab with the testing setup completed prior to starting measurements. For these cases, the FRF or spectrum required are calculated online. For other testing scenarios, the vibration data may need to be collected and recorded in the field. Afterwards, the data file can be recalled for the playback analysis to compute the FRF signals or CPS signals.
EDM Modal software provides the Playback Analysis feature which allows users to import recorded time signals and process measurement data to obtain the related spectrum signals. This feature allows users to carry out all the field measurements in one attempt before post-processing and analyzing the measured data in detail on a lab PC.
Playback Analysis is an available software option for EDM Modal Hammer Impact, SIMO/MIMO FRF and Operational Modal Analysis test types to support experimental data obtained through hammer impact, shaker excitation, or ambient excitation data.
Recording Time Stream Signals
Each testing type of EDM Modal software allows time stream signals to be recorded as digital files when FRF or CPS signals are measured. In the Measurement tab, the Testing Plan is the area displaying the test being carried out. It operates not only with the FFT data being acquired, but also with the time stream signals being recorded. Also shown is the status of acquired signals and recorded signals. For each measurement entry, the saved signals and recorded files are listed once the measurement for that entry is performed.

Figure 1. Recording files in Testing Plan
After all measurement entries are done testing and recording, the Stop button is clicked. The auto download recording file window will pop up and start downloading the recorded files to the PC.

Figure 2. Download data
The Testing Plan will display details of the recorded file in the files window.

Figure 3. Testing Plan after recorded file downloaded
Each measurement entry now has the recorded file available. In order to playback and analyze the recorded time stream data files, each measurement entry recording needs to be done so that the complete set of measurement DOFs raw time stream data is saved.
The desired number of averages can be set when measuring signals. Users can set the recording time in general to be longer when recording time stream signals. When the recorded file is recalled for playback analysis, users have the opportunity to select the start and end points of the time signal to perform playback analysis. It is always better to record more data than less.
Playback Analysis
After all recording files are saved into the Testing Plan, the data is ready for playback analysis to calculate the FRF signals for a Hammer Impact test, a SIMO/MIMO FRF test, or CPS signals in an OMA test.
When the recoding is completed with the same test, the Testing Plan will have all the recorded files populated to the corresponding measurement entries. When a measurement entry does not have an associated recording file, users can manually associate a recorded file with it. Make sure the recorded file has the same DOF information as that of the measurement entry.
Bring EMA software into Playback Analysis mode by clicking the button On from the Control Panel. Remember to disconnect the Spider hardware before switching the mode to Playback Analysis.

Figure 4. Playback Analysis switch
If a measurement entry is selected for the analysis, the corresponding recorded file will be displayed in the compressed display window.

Figure 5. Playback Analysis mode
The default signal shown is the channel 1 excitation force. Click the signal icon at the lower left corner of the Record Display window, users may select additional channels of time signals.
Users can place the yellow rectangular box to set the start and end point of the time signal for Playback Analysis. Entering start or end time to the control panel will move the yellow box accordingly. The time data within the yellow box will be analyzed to compute the FRF signals and more.
Once all measurement parameters are set, clicking the Run button will result in the calculation of all the spectrum signals and will yield the desired FRF signals, coherence signals, and more.
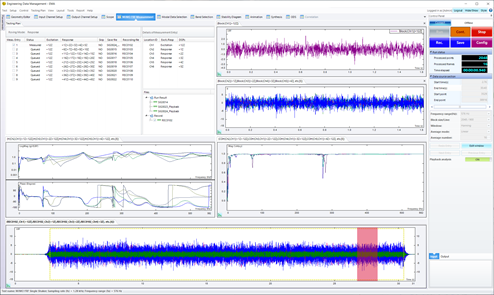
Figure 6. Playback Analysis
The Files of Testing Plan window displays Run Results with multiple signals saved for measurement entry 1.

Figure 7. Files of Testing Plan
SIG0014 was the signal acquired from the online measurement. SIG0023_Playback and SIG0024_Playback are signals from Playback Analysis.
The FRF signals from the most recent Playback Analysis are populated into the Modal Data Selection tab for modal analysis. Once all the measurement entries are completed for Playback Analysis, the FRF data set in the Modal Data Selection tab is complete.

Figure 8. Modal data selection
Make sure all FRF analysis is acquired with the same measurement parameters (e.g., frequency span, number of lines, etc.). If any parameter needs to be changed, Playback Analysis will be performed for all measurement entries.