
Modal Analysis of MRI QBC Carrier Using EDM Modal
The experimental object undergoing modal analysis in this paper is a medical MRI QBC carrier structure, which is used to support patients laying in beds. The entire carrier is comprised of FRP composite material, and a thin board sheet installed with chips, capacitors, resistors, and other components is adhered in the middle section. For the experimental modal test, the carrier is hung using elastic ropes to imitate free-free boundary conditions.
The goal of this endeavor is to study the QBC radial mode, natural frequency, mode shape, damping ratio and other modal parameters. Through modal experiments, it is possible to identify weak links in a structure, avoid resonance, and increase the fatigue life of a product, which can help improve the rationality of product design and improve product performance.

Figure 1. QBC Carrier Structure

The Crystal Instruments’ Spider-80X vibration analyzer, PCB lightweight single-axis accelerometer, and PCB percussion force hammer are used for this experimental setup. Crystal Instruments EDM Modal software is used to execute the modal test measurements and process data to obtain the modal parameters.
Table 1. Test system and software
| Name | Model | Specification | Comments |
|---|---|---|---|
| Data acquisition and analysis systems | Spider-80X | 8 Channel | Crystal Instruments |
| Force hammer | 086C03 | 500 N | PCB |
| Acceleration sensor | 333B30 | 3×100mV/g | PCB |
| Software | EDM Modal | 10.0.0.2 | Crystal Instruments |
The geometric model of the structure is established using EDM Modal, with a total of 40 measurement points on an 8×5 mesh grid as shown in the screenshots below.

Figure 2. Geometric Model of the Structure

A roving excitation with three fixed responses is used to execute this impact hammer modal test which will result in three rows filled in the FRF matrix.
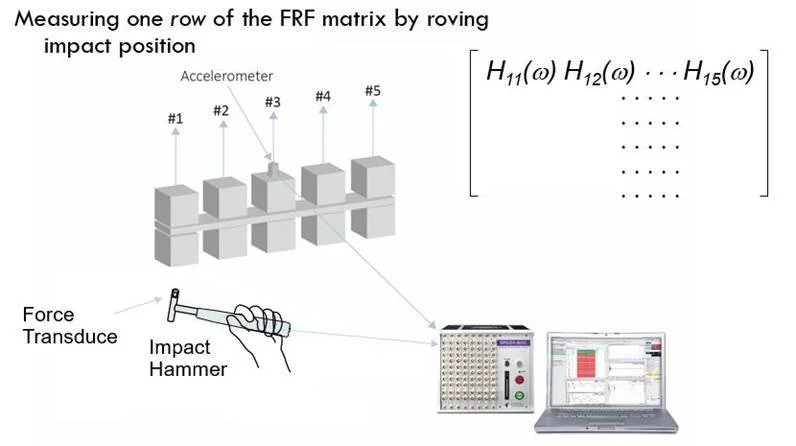
Figure 3. Schematic diagram of a roving excitation hammer impact modal test
A screenshot of the hammer impact modal measurement is shown below. There are quite a few modes captured in the desirable frequency range. The coherence plot indicates that the input and output are well correlated and provide confidence about the measurements.

Figure 4. Measurement tab screenshot

Figure 5. Test data preview
Modal data selection allows users to overlap various measured FRFs to view the global picture of all present modes in the interested frequency range as shown in the preceding screenshot.
Three fixed accelerometers provide three references for Complex Mode Indicator Functions (MIFs) to indicate where modes are present.
The latest curve-fitting algorithm labeled Poly-X (p-LSCF) is used to analyze the first ten modal results (including frequency, damping and mode shape information).

Figure 6. Stability Diagram

Figure 7. Modal Results of MRI QBC Carrier
The Modal Assurance Criterion (MAC) is used to check the consistency and correlation between modes of various orders. The diagonal elements of the MAC matrix of this modal experiment are close to one and the non-diagonal element values are small. Users can determine that the orthogonality of modal vectors from each order and the decoupling between most modes is better, but due to structural nonlinearities and other factors, there is a weak coupling between several modes.

Figure 8. Modal Assurance Criterion (MAC) Chart
Information about the first 15 mode shapes is provided in the table below:
Table 2. Mode Shape Data
| Mode number | Frequency (Hz) | Damping Ratio (%) | Mode Participation 1 | Mode Participation 2 | Mode Participation 3 |
|---|---|---|---|---|---|
| F#1 | 74.702 | 0.52 | 96.46 | 11.38 | 100 |
| F#2 | 91.8 | 0.301 | 8.42 | 100 | 11.62 |
| F#3 | 179.313 | 0.614 | 100 | 61.85 | 49.24 |
| F#4 | 184.804 | 0.915 | 25.02 | 24.23 | 100 |
| F#5 | 231.194 | 0.642 | 100 | 57.67 | 9.35 |
| F#6 | 234.189 | 0.414 | 37.43 | 100 | 7.59 |
| F#7 | 239.886 | 0.744 | 100 | 29.74 | 8.96 |
| F#8 | 241.43 | 0.533 | 100 | 73.64 | 28.13 |
| F#9 | 263.382 | 0.952 | 37.04 | 100 | 24.14 |
| F#10 | 308.787 | 0.769 | 41.5 | 22.41 | 100 |
| F#11 | 312.147 | 0.877 | 26.83 | 100 | 52.23 |
| F#12 | 362.618 | 0.924 | 33.68 | 100 | 98.02 |
| F#13 | 471.391 | 0.623 | 94.12 | 27.86 | 100 |
| F#14 | 501.049 | 0.834 | 6.18 | 100 | 30.74 |
| F#15 | 561.374 | 0.937 | 62.88 | 100 | 77.71 |
The 15th order mode measured by the experiment has complex vibration characteristics, and the first few modes are selected according to the bottom surface of the circumference and the cylindrical surface, respectively.
Fig.9-14 shows the mode shape diagram, mainly showing the vibration of the bottom surface. Figures 9-10 are elliptical mode shapes. Figures 11-12 are three-valve mode shapes and Figures 13-14 are four-valve mode shapes. Since the object under test is an asymmetrical structure, there is no heavy root mode in the radial direction.
Fig.15-16 shows a mode shape diagram, mainly showing the overall bending vibration of the cylinder. Fig. 15 is the overall 1st order bending and Fig. 16 is the overall 2nd order bending.
Due to the large number of mode shapes and many composite vibrations, more accurate conclusions may require a mutual argument analysis with the help of finite element calculation results.
Each order of mode shapes is displayed in the following screenshots:


The overall modal recognition effect is acceptable. Despite limited time, if conditions and time become available in the future, there is room for improvement in several aspects:
At present, the number of measurement points is 8×5 with a total of 40 measurement points. The measurement points can be arranged more densely which may result in better identification results.
At present, three acceleration sensors are arranged on the test subject. The complex structure along with a relatively large volume and weight can result in a relatively small acceleration response from a collection point. Additional sensors can improve the results.
Field test difficulties arose from the circuit board film adhered on the structure surface. The fit between the film and structure was not particularly tight and produced a great impact on the percussion. The area must be vigorously tapped to reduce the impact. This made it impossible use an exciter because the sensor was pasted into a gap and the acceleration signal could not be collected. Performing a modal experiment before adhering the board film may improve test results.