
How to Read CI Data Files in Matlab
Introduction
The ATFX API C# DLL files can be used in three supported coding languages: Python, Matlab and LabVIEW. Fortunately, Matlab has a built-in function to reference C# DLL files and import various properties and functions.
For more detailed information on how to implement the following code sections and properties in a class, please refer to the ATFX API manual and the provided C# & Matlab Demo code. The package can be downloaded from our Programming Corner.
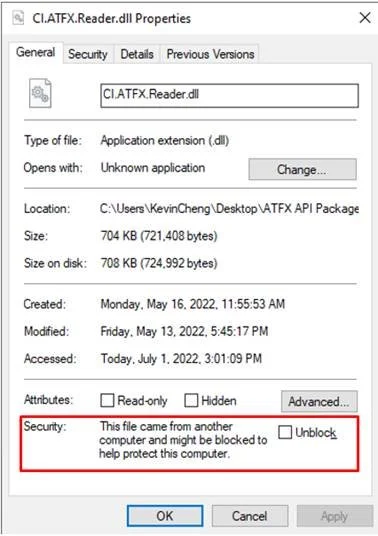
There are times when the script is reading the correct file path and the DLL files exist, but the script shows an error stating that it cannot find the DLL files. One solution is to click a box labeled Unblock in the DLL file properties accompanying the following description, “This file came from another computer and might be blocked to help protect this computer.”. Unblocking the DLL file should allow the scripts relying on the DLL files to locate and read them.
Importing C# DLL Files to Matlab
Matlab includes a function identified as NET.addAssembly that can import ATFX API DLL files. The documentation is here: https://www.mathworks.com/help/matlab/ref/net.addassembly.html.
R2009a became available when the NET.addAssembly function was introduced, thus it is recommended to use R2021b or later to utilize numerous quality-of-life improvements provided by Matlab.
% Load common and reader dll |
Opening an ATFX File and Extracting Various Data
The provided Matlab Demo Script demonstrates how to extract and display a signal property in addition to plotting out its frame data. A significant Matlab advantage is the ability to visualize signal data values.
%create a atfx recording instance %use item function to get signal instance %display signal properties disp("display signal frame data"); %plot the signal |
The following screenshot is an example of the provided Matlab Demo Script print statements:
