
Modal Testing using the CoCo-90X
Download PDF | © Crystal Instruments 2018, All Rights Reserved.
Studying the modal properties of the structure under test is important to optimize the design of the test structure and to improve the NVH characteristics. Finite Element Analysis is widely used to obtain the mechanical properties of different objects. However, it is not only difficult to replicate the exact environmental constraints and boundary conditions but also challenging to obtain the damping ratios of the different modes. Experimental modal analysis not only helps in solving these issues but can also help in validating the results of the finite element model.
Establishing long connections between a computer, digital signal analyzer and the test structure is not only tedious but also increases the complexity of high-channel count tests. The new portable 16-channel CoCo-90X by Crystal Instruments overcomes these issues. This handheld instrument not only acts as a data recorder but is also a dynamic signal analyzer which allows the user to perform real-time processing of measurements. The touch screen user interface provides the flexibility to navigate through the complete setup process very quickly.

Figure 1 Modal Impact Hammer Testing using the CoCo-90X
A modal test on a plexiglass plate is carried out using the new CoCo-90X. The plexiglass plate is divided into a mesh configuration consisting of 45 measurement points. This provides a higher spatial resolution for the mode shapes. Suspending the plate using bungee cords helps achieve the free-free boundary condition. The plate is excited at a single point and the response of the plate is captured by roving nine uni-axial accelerometers over the entire structure. Out of-plane mode shapes are of interest for this test and hence the excitation and response are only measured along the z-direction.
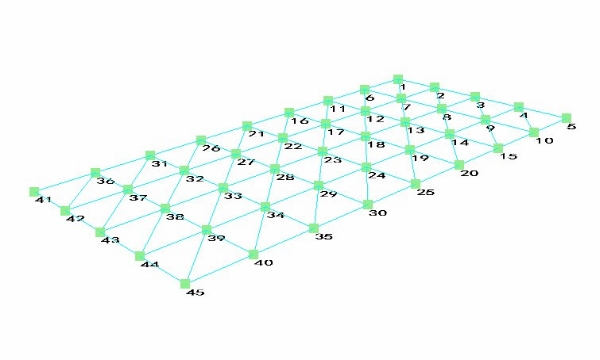
Figure 2 Plexiglass plate geometry
The Modal Data Acquisition (MDA) mode under Digital Signal Analyzer (DSA) mode of the new generation CoCo-90X is used to execute the hammer impact test on the plexiglass plate. The readily available FRF_MDA (16) test project not only guides the user through the entire test setup but also allows the user to change the display style of different signals making the entire test experience simpler and convenient. The different settings, channel configurations and modal analysis parameters can be quickly set-up before executing the impact hammer test. The 16-channel CoCo-90X not only powers the IEPE modal impact hammer but also the IEPE accelerometers connected to the other channels.
Once the MDA mode in DSA is selected and the FRF_MDA (16) test is created, the display window settings can be chosen under the Traces tab. Choosing the two-trace window allows the user to view the time domain data of the excitation and response channel along with the transfer function. These two traces of the time and frequency domain are displayed alongside the trigger window.

Figure 3 Trace window of signals on CoCo-90X
The parameter tab contains a list of different settings that are established before executing the test. The user chooses the block signals to be saved, for example, the time waveform, APS, CPS, FRF and coherence. Closely monitoring these parameters helps to carry out a good test. After this is done, the input channel table is configured to save the DOF details (measurement point ID and direction), sensitivity of the sensor and input mode (IEPE) for the excitation and response channels. The increment points in this roving response test can be set to the number of accelerometers that are used for the test (9 for this test case).

Figure 4 Input Channel settings on CoCo-90X
The sampling rate is set to 1.6 kHz which is more than twice the desired frequency range of 750 Hz (Nyquist-Shannon theorem) and the block size is set to 2048 so that no windowing is required and the response decays naturally. Linear averaging with 4 number of averages is used to calculate the FFT of the time domain data. The trigger settings for the excitation channel can be set accordingly and the double-hit detection can be enabled to aid the user in achieving good excitation sample data.
After each measurement run, the user can manually save all the data and signals, or the auto-save feature can be turned on.
The saved files are now transferred from the CoCo to the computer. This can be done through WiFi or by connecting an Ethernet cable. An SD card also works. The EDM CoCo-DSA software converts the measurement signals from .rec format to. atfx and .dat format which will be imported into EDM Modal software for modal parameters estimation.

Figure 5 File Conversion in EDM CoCo-DSA software
Importing the converted signals into the modal software and opening them to modal data selection allows the user to overlap the real and imaginary part of FRF signals for all the measurement points.

Figure 6 Modal Data Selection in EDM Modal software
Using the new Poly-reference Least Square Complex Frequency (p-LSCF) Domain method, known as Poly-X, the FRFs can be curve-fit using a 32-order polynomial to obtain the following stability diagram. Selecting the stable poles helps in identifying 8 modes in the desired frequency range.

Figure 7 Stability diagram
After the poles are identified and selected, the mode shapes associated with each of these poles can be identified.
The Modal Assurance Criterion (MAC) helps in validating the measurements. The Auto-MAC matrix shows that the modes are uniquely identified. The matrix has high diagonal elements which shows that the mode shapes are orthogonal to each other.

Figure 8 MAC chart
Finally, the animation tab helps in the visualization of different mode shapes. The various new features (such as node lines, smoothing etc.) assist in improving the animation of the different shapes.
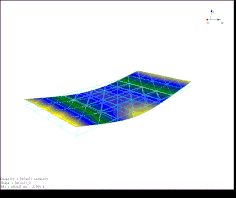
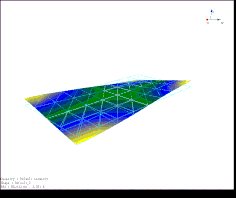
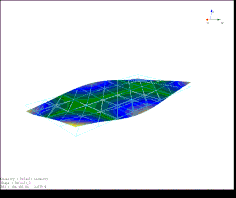
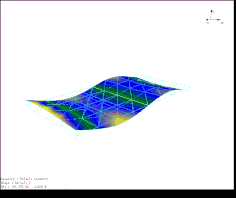

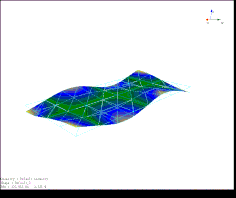
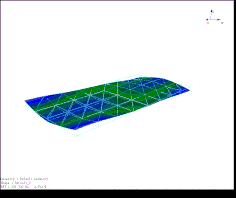
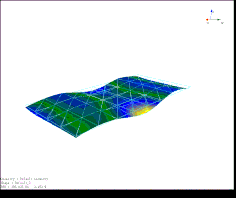
Figure 9 Mode shapes of the Plexiglass plate
Using the lower and upper residual (to compensate for the modes that excite the structure but are not present in the frequency range of interest) a synthesized FRF can be obtained. Comparing the synthesized and the measured FRF validates the model. The high correlation and close to zero error indicate a very good overlap between the synthesized and measured FRF, as shown in following figure.

Figure 10 Mode Synthesis
Successfully measuring the vibration characteristics of the plexiglass plate under test shows the robustness of the CoCo-90X hardware and the EDM Modal software.
To learn more about EDM Modal software, visit: https://www.crystalinstruments.com/structural-testing