
Modal Space - In Our Own Little World

Illustration by Mike Avitabile
Is there any real advantage to MIMO testing?
Why not just use SISO and then move the shaker? Let's talk about the differences.
Multiple input multiple output (MIMO) testing has many advantages when compared to data collected from single input single output (SISO) testing. The energy from multiple shakers allows the structure to be more uniformly excited throughout the entire structure and thus allows for the development of better frequency response functions (FRF). When only using a single shaker, the measurements obtained are generally not as good as those obtained from multiple shaker excitations, especially when considering larger structures. With single shaker methods, many times it is difficult to get a reasonably good level of excitation throughout the entire structure.
Another important factor is the effect of the shaker setup on the test article to be measured. With single shaker testing methods, the shaker system must be setup multiple times in order to obtain multiple reference data necessary for polyreference curvefitting techniques. Many times the test setup may have an effect on the measured FRFs. When multiple reference data is collected with a single shaker, this can be a serious concern. The data that is collected with MIMO testing is generally more consistent when compared to equivalent data collected SISO testing.
In order to see some of the differences, some data was collected on a structure using both single shaker and multiple shaker excitation techniques. Four different sets of data were collected:
SISO with random excitation and a Hanning window
SISO with burst random excitation and no window
MIMO with random excitation and a Hanning window
MIMO with burst random excitation and no window
In all cases, a reciprocal FRF measurement between the two excitation locations was collected. The accelerometers were permanently mounted to the structure for all testing performed to minimize any mass loading effects that might otherwise occur. Only the shakers were connected and disconnected between the various measurements obtained. (The shakers were actually placed at the measurement locations and then connected or disconnected as necessary to minimize the effects of shaker setup problems.) The FRF measurements for all four cases are shown in Figure 1. Each graph contains two reciprocal FRFs - Hij and Hji.
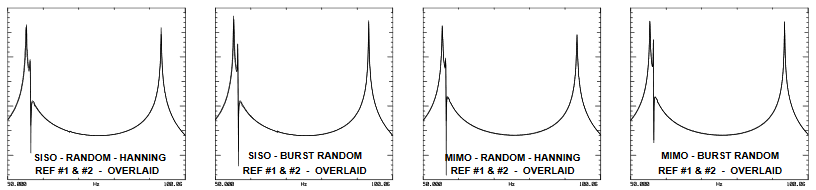
Figure 1 - Reciprocal FRFs for All Data Sets Compared over the 50 to 100 Hz range
On first glance, it appears that all four techniques provide similar data. The FRFs appear reasonably good. However, upon closer inspection of each of the techniques, differences will be easily seen in the reciprocal measurements (Figure 2).
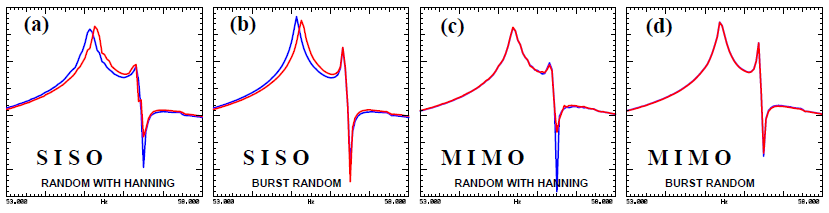
Figure 2 - Reciprocal FRFs for All Data Sets Compared over the 53 to 58 Hz range
First, look at the FRF measurement using SISO with random excitation shown in Figure 2(a). Note that the two curves do not line up very well especially at the first resonant peak shown. Also notice that the random excitation exhibits significant variance on the FRF measurement even with the Hanning window applied; this is due to the leakage effects of the random excitation process which are not completely removed through the use of the Hanning window. The shift in the peak of the FRF is directly attributed to the shaker setup and the stiffness effects of the stinger attaching the shaker to the structure. The test setup clearly has an effect on the measured FRF data.
Next, look at the FRF measurement using SISO with burst random excitation shown in Figure 2(b). Notice that the two peaks still do not line up very well at the first resonant peak. However, the burst random excitation provides a much better measurement when compared to the random excitation with the Hanning window applied. The burst random excitation generally provides a much better overall measurement since no window is necessary for the collected data. This is due to the fact that the measurement satisfies the periodicity requirements of the FFT process. The random excitation will generally need many more averages in order to reduce the variance on the measured FRF data and will still not produce as nice a measurement as the burst random excitation.
Now, look at the FRF measurement using MIMO with random excitation shown in Figure 2(c). The peaks at the first resonance compare much better than in the previous case. However, there is still significant variance of the FRF in general and significant differences exist mainly at the antiresonance. Since both shakers are mounted on the structure at the same time, the effects of the mounting of the shaker are similar for the duration of the test. Therefore, the resonant peak is not affected by the setup configuration.
Finally, look at the FRF measurement with the MIMO with burst random excitation shown in Figure 2(d). This reciprocal measurement is almost identically the same. Obviously, this measurement is the best of all the measurements considered. The burst random MIMO excitation has the best overall characteristics - the measurement does not need a window to be applied since there is no leakage and has the consistency necessary in the reciprocal FRF since the shakers are mounted simultaneously on the structure for the duration of the test.
So from the SISO and MIMO data evaluated, it is clear that the MIMO data produces more consistently related data. The SISO measurements clearly showed differences when evaluating the resonant peaks. In addition, the burst random excitation produced much better results when compared to the random excitation with the Hanning window applied.
Another interesting point is shown in Figure 3. Notice that the two SISO and MIMO all produce different results. This clearly shows that the test setup has an effect on the measured FRFs. Of course, we realize that the peaks of the FRF may be affected by the stinger stiffness attaching the shaker to the structure, but at least with the MIMO configuration, the peaks are consistently related. (This can be a very critical point especially when performing multiple reference modal parameter estimation techniques to extract the modes of the system.)
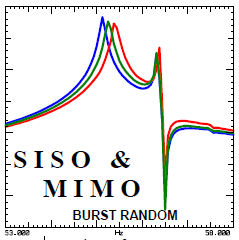
Figure 3 - Comparison of SISO & MIMO FRFs
I hope this example helps to show the advantages of MIMO testing techniques. If you have any more questions on modal analysis, just ask.