
Modal Analysis of Bullet Train Wheel using EDM Modal


Figure 1. Modal hammer testing of the train wheel
It is crucial to understand the mechanical properties of a structure to optimize the useful range and life cycle of the test specimen. Performing modal testing and carrying out the modal analysis of a unit under test (UUT) assists in analyzing the modal parameters of the test object. The natural frequencies, damping and mode shapes of the UUT further helps in improving the design to enhance the structural behavior of the test unit. Thus, modal analysis is a critical part of product development.
This article examines the acquisition of modal characteristics from a bullet train wheel by performing experimental modal analysis. The wheel vibrations affect the dynamics of the wheel-rail interactions. Understanding these vibration characteristics will help mitigate the vibration and noise at high speeds. During the ride or brake operation there could be certain excitation frequencies which could cause the resonance phenomenon and potentially affect the safety and comfort of passengers. Hence, it is vitally important to study the resulting effects from modal analysis to avoid the unpleasant vibration and noise.
A hammer impact test is carried out using a modal hammer and 4 tri-axial sensors to obtain the vibration characteristics of a train wheel. The short pulse induced with a modal hammer excites a wide range of frequencies. Another advantage of a hammer impact test is the quick and easy setup process. The modal test is carried out with a roving excitation method to avoid the mass loading effect induced with a roving response measurement.
The efficient Spider-80Xi dynamic measurement system is used to execute the modal test. The latest 9.1 release of EDM Modal software is used to execute the hammer impact modal test.
A mesh configuration of 108 measurement points is distributed radially and circumferentially over the bullet train wheel to obtain a good spatial resolution for the mode shapes. Using a flexible cord, the bullet train wheel is hung to imitate a free-free boundary condition (as shown in the experimental setup). A modal hammer with a metal tip is roved through the various measurement points. The responses to the impact excitations are captured using 4 tri-axial accelerometers that are placed accordingly. Measuring the excitation and response in the vertical direction (“Z”) facilitates the procurement of “out-of-plane” mode shapes.

Figure 2. Bullet train wheel geometry
For this modal test, the first 9 modes are of interest and therefore a sampling rate of 12.8 kHz is set. A block size of 8192 is selected. A fine frequency resolution of 1.5625 Hz is produced with these configuration settings. Measurements of higher accuracy and reduced noise are obtained by linearly averaging 4 blocks of data at each measurement DOF.
The broadband spectrum from the metal tip on a modal hammer assists in exciting the modes up to a frequency range of 5.5 kHz. The large block size implemented helps ensure a natural decay of the structure response without introducing a conventional force-exponential window. Another added advantage of this block size is a finer frequency resolution. With this setup, there is no leakage, and a uniform window can be selected.

Figure 3. Hammer impact measurement of the bullet train wheel
The coherence plot helps users validate the measurement results; it looks good from the preceding screenshot. The valleys in the coherence plot occur at the anti-resonances which indicates that the response level is relatively lower at these corresponding frequencies. So overall, the inputs and outputs are well correlated in the desirable frequency range.
The DOF of the excitation and response for the measured FRF signals are switched automatically during roving excitation testing. This can be observed from the Modal Data Selection tab.
The FRF measurement displays good dominant peaks in the 0-2000 Hz frequency band. Overlapping the out-of-plane (“Z”) measured FRFs, several modes can be identified. The good alignment of these peaks indicates good measurement results, and no mass loading effect was induced.

Figure 4. Modal Data Selection tab showing the magnitude and phase part of all overlapped FRFs
The Complex Mode Indicator Function (CMIF) is used to locate modes in the desired frequency range. In addition, the summed FRF is also observed to identify the modes. The new Poly-X method is used to curve-fit the FRF’s to procure the following stability diagram. Six flexible modes are selected within the desired frequency range.
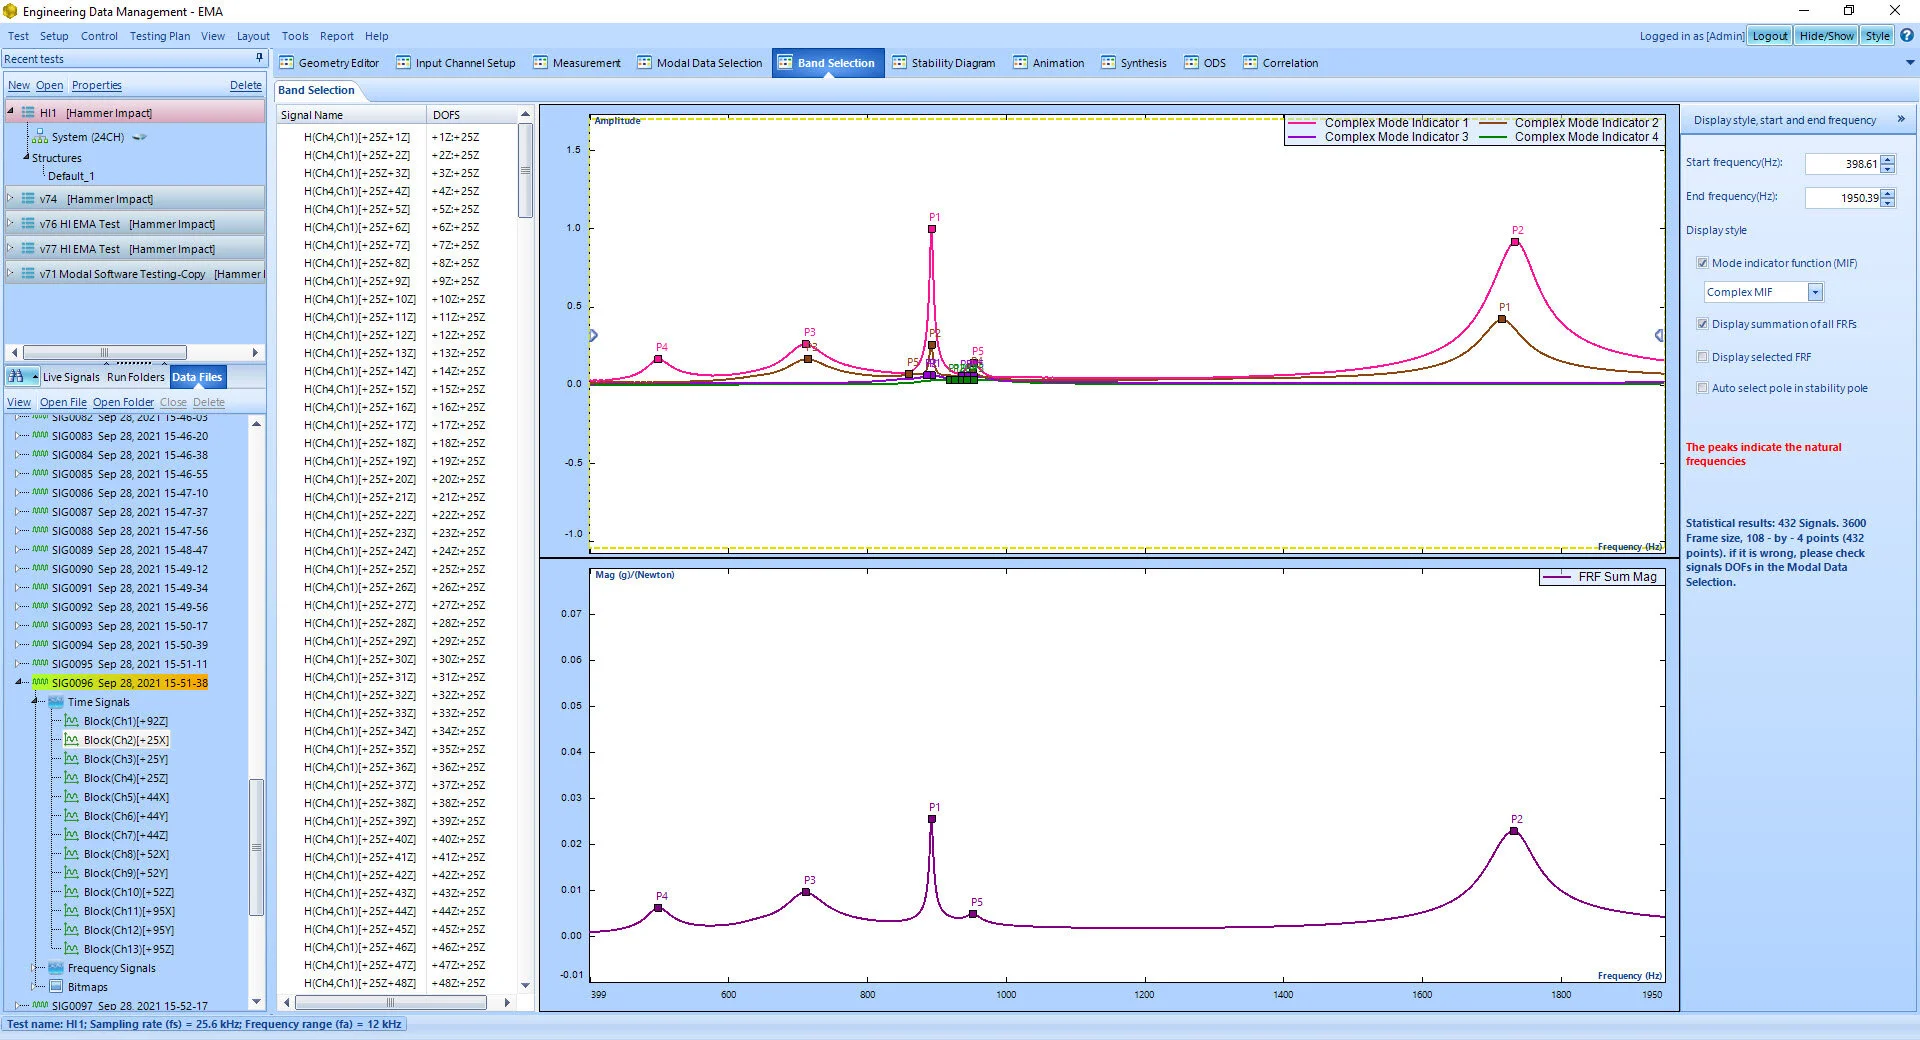
Figure 5. Mode Indicator Functions to locate and identify the modes in the desired frequency range
The stable poles (stable frequency and stable damping) are selected to obtain the natural frequencies and the damping ratios of the interested modes.

Figure 6. Stability Diagram to identify the poles
The residue calculation obtains the mode shape associated for each mode.
The Auto-MAC matrix helps users validate the results. The Auto-MAC matrix below shows users that the modes are orthogonal to each other (low off-diagonal elements) and are uniquely identified (high diagonal elements).

Figure 7. Auto-MAC chart for the identified modes
The first bending mode of the bullet train wheel at 499.049 Hz is animated below.

Figure 8. 1st Order Bending mode at 499 Hz
The following modes show the torsional vibration of the bullet train wheel at 708.342 Hz which is then shifted by 90 degrees at 712.675 Hz.


The following modes shown the 2nd order bending of the bullet train wheel and how it shifts by 45 degrees within 1 Hz frequency.


The radial modes (or breathing modes) are also identified. The following GIFs show the radial vibrational motion of the train wheel and how it shifts by 45 degrees within 2 Hz frequency.


The bending motion of the inner section of the bullet train wheel is obtained. This 2nd order bending vibration mode of the bullet train wheel also shifts by 90 degrees.


The modal analysis results show the practical use and application of modal testing on industrial structures. The results emphasize the strength of the Spider-80Xi DAQ system and the efficiency of EDM Modal software to execute sophisticated modal tests on intricate structures.
To learn more about EDM Modal software, visit: www.crystalinstruments.com/edm-modal-testing-and-analysis-software/