
Ground Vibration Testing (GVT) of Aircraft Assembly
Summary
A Ground Vibration Test (GVT) involves carrying out modal analysis of an aircraft and its sub-assembly components to analyze and detect any changes in their structural properties. The modal parameters determined through this testing are used to validate analytical models. The modal characteristics are also used to predict the flutter of the aircraft in order to create a safe flight envelope before flight operation. Thus, GVT is a crucial process in the design and development cycle of aircrafts.
Keywords: Ground Vibration Test, Modal Test, Structural Dynamics, Resonances,
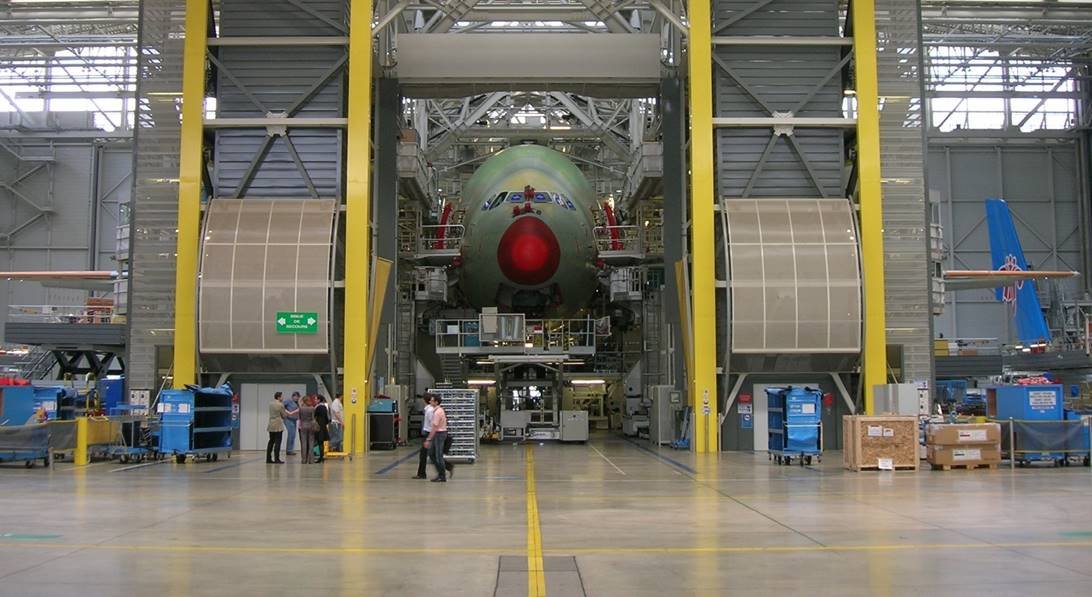
Figure 1. Ground Vibration Test on Aircraft Assembly for Flutter Prediction
Abstract
Increasing financial constraints combined with the time sensitive nature of aircraft development results in an increase of technical challenges for aircraft design and testing. To ensure an airplane meets the desired standards and requirements, a thorough analysis is necessary. Using composite materials or lightweight components help increase efficiency while potentially producing unknown effects on the structural performance of the aircraft. To combat these complexities, extensive testing is desirable to measure, analyze, and validate aircraft designs.
The tests involved through the development cycle of aircrafts help users to assess the pass/fail criteria implemented by the certification process. Executing experimental measurements is used to observe compliances with the certification standards and can also be used to improve the accuracy of the finite element models. GVT is an important part of this testing process. This high-channel count modal test involves testing the entire airplane assembly before its first flight operation to ensure that all the requirements by the certification authorities are met. These requirements are established in place based on the size and type of airplane. If the testing passes the requirements and standards, the results help users verify that an aircraft is free from flutter and is within the flight envelope for safe flight operations. Thus, ground vibration testing is an integral part of aircraft safety standards. GVT is not only used as a validation method but is also used to assist with changes in mechanical properties of the aircraft to optimize the design and enhance its structural performance.

Figure 2. Basic Workflow of GVT Modal Test on aircraft assembly and its sub-components
The main purpose of GVT is to verify the flutter results from simulation tests and mitigate the risk of these tests. An extensive modal test on the complete aircraft assembly is used to fine tune the finite element models for predicting flutter. The modal parameters obtained through the results of these modal tests are the natural frequencies, damping ratios and mode shapes for each configuration of the aircraft assemblies. Furthermore, some structural coupling tests are also performed to correlate and improve the simulation models and improve the flight envelope to mitigate the flight flutter. The structural coupling test involves vibrating the aircraft in a suspended condition and observing the response of the sensors to analyze the behavior of the aircraft during the actual flight condition.
Ideally, GVT is performed in the final stages of the development cycle after the entire aircraft assembly is ready for testing. Time constraints along with testing multiple configurations require efficient execution of ground vibration tests. The quicker these tests are performed, the more helpful the results are in assisting with design optimization. EDM Modal provides the right tools to execute thorough ground vibration tests and obtain accurate results to further enhance structural performance.
Workflow
There are several important stages that need careful and timely management throughout the testing process. The initial stage is to prepare the test, and this can be optimized by using results from simulation models. Having an efficient hardware system can help optimize the excitation and data measurement process. On-field analysis of the measured test data can help users decide if a test can be executed with another experimental configuration. After all measurements are carried out, a huge chunk of data must be efficiently handled and transferred. Post-processing of this large dataset provides the necessary results to meet compliance standards and ensure safety.
Preparing the Test
FEA models are analyzed to obtain simulation results of intricate test structures. The dynamic properties of these models can be optimized by executing physical GVT tests. The experimental tests help users improve simulation models. However, there are many uncertainties when dealing with a large modal test on aircraft assemblies.
How many sensors are required for the ground vibration test?
What are good measurement locations on the aircraft assembly for these sensors?
What are good drive point locations to place modal shakers for sufficient excitation of all the modes?
Are the boundary conditions properly established that the first flexible mode is well separated from the highest rigid body mode?
The finite element model can actually help with optimizing the experimental setup for the test. Usually, for large structures, the modal measurements are acquired in one-shot, i.e., with all the sensors attached. However, if there was a limitation on the number of sensors or the number of measurement channels on the data acquisition system and a roving response modal test was executed, the intensity of the mass loading effect can be simulated in the finite element models to observe the effect. Also, the optimal drive point locations for the modal shakers can be efficiently obtained from the simulation models. A good drive point location would indicate sufficient excitation of the global modes of the aircraft assembly. The number of modal shakers desirable for the modal test can also be planned based on the fact that all the interested modes are present in the frequency response function (FRF) plot. The Modal Assurance Criteria (MAC) chart can not only help in optimization of the spatial resolution (i.e., the number of measurement points) but also in efficiently choosing good sensor locations for the modal test. Ideally this results in uniquely identifying each mode of vibration. Finally, the finite element model can also be exported for the measurement grid on the geometry model for an experimental modal test. This process helps improve the integration of the experimental and simulation tests.
Efficient Hardware and Software for Ground Vibration Test
The setup and instrumentation involved for a GVT modal test is time consuming and involved. A large number of sensors are used to capture the response of an entire aircraft assembly. It is important to ensure each sensor is carefully mounted on the measurement point in the precise orientation. Room for errors with these high-channel count tests can have a negative effect on the results. Having simple features like “Read All TEDS” and highlighting the mapped measurement points on the grid can significantly help with this process.

Figure 3. Read TEDS functionality for hundreds of sensors used in a GVT test
The Read TEDS feature automatically reads details like Measurement ID and direction, sensitivity and input mode from the programmed sensor chip.

Figure 4. Mapping sensor locations to the measurement grid on the aircraft assembly
Also, the efficiency of the hardware to handle the synchronization of all channels greatly improves the quality of measurements and provides confidence regarding the data acquisition. Hardware systems like the Spider-80M and Spider-80Xi with chassis structures with interchanging slots are extremely useful for these tests. Furthermore, multiple high-channel count systems can combine to create a simultaneously sampled large system.

Figure 5. Spider-80M & Spider-80Xi used for high-channel count data acquisition
Accurate time synchronization results in excellent phase match in the frequency domain between all the channels. With patented dual ADC technology, signals as minute as 6 μV and as large as 20V are well detected on each measurement channel.
For a ground vibration test, the aircraft is hung with soft cords to imitate a free-free boundary condition. A general rule of thumb to ensure that the boundary conditions are good is to set the frequency of the highest rigid body mode at less than 1/10th of the first flexible mode.
Multiple accelerometers are mounted onto the aircraft. Multiple modal shakers are used to excite it and obtain multiple-reference frequency response functions (FRFs). A high-channel count data acquisition system (as shown in Figure 5) efficiently handles these large channel test datasets.
The modal shakers for GVT are typically attached to the aircraft wings and tail. It is also possible to attach a modal shaker to the fuselage of an aircraft. Several output excitation types (such as Random, Sine, etc.) can be used for these Multiple-Input-Multiple-Output (MIMO) modal tests.
The EDM Modal software is a complete testing and analysis suite that intuitively handles the geometry, measurement, and processing of these GVT modal tests. Various efficient curve-fitting algorithms are available for analyzing the MIMO FRFs to extract the modal parameters of an aircraft assembly.
Executing GVT Modal Measurements
The GVT modal test is executed to obtain all the FRFs after the experimental setup is established with appropriate boundary conditions and all sensors are connected to the hardware system with measurement and excitation points laid out. There are several excitation signals that can be used to execute these GVT measurements. A modal hammer can be used for impact measurements. Modal shakers can use several output excitation types such as Shaped Random, Burst Random, Sine, Swept Sine, Pseudo Random, etc. The careful selection of an output excitation signal can help optimize the accuracy of measurement results.

Figure 6. Various output excitation types available for GVT modal test on aircraft assemblies.
Random excitation signals are useful for exciting a wide frequency range and assists in capturing all the interested modes of an aircraft within a short time duration.

Figure 7. White Noise Excitation used for exciting wide frequency range in GVT modal test
Adding a parameter to customize the burst percentage allows users to ensure that the response decays naturally without having to implement the conventional Hanning window.

Figure 8. Burst Random Excitation used to ensure natural decay of aircraft assembly response
Periodic Random has the phase and magnitude both randomized from one block to the other blocks. Pseudo Random is also the periodic type of random waveform. The difference from Periodic Random is that only its phase is randomized when a block of Pseudo Random is generated.

Figure 9. Psuedo & Periodic Random Excitation used for user-controlled randomization
With Periodic Random or Pseudo Random excitation signals, the user can tune two parameters: Number of delay and Number of Cyclic times.

Figure 10. Number of delay and cyclic blocks for Pseudo & Periodic Random Excitation in GVT modal test
Due to the nature of periodic responses, the time domain average can be carried out for these data blocks. After that, one spectrum will be computed to yield all the corresponding spectra, including FRF signals. This process will be repeated for the time of spectrum average number times, i.e., 10 for this setting.
Using a periodic output waveform results in significantly longer test time. The turnout is accurate measurement results.
Shaped Random and Burst Shaped Random excitations allow users to specify a drive PSD profile. This allows for concentrating more energy in a certain frequency range. By improving excitation to the structure under test since the level of excitation can be tuned over the frequency range, this will increase the signal to noise ratio in regions where the response level is lower.

Figure 11. Shaped Random & Burst Shaped Random Excitation for plugging in a PSD drive profile
Dedicated sine excitations like swept and stepped sine provide a very good signal-to-noise ratio by focusing all the energy at one frequency point at a time. When testing these large structures, broadband excitation cannot possibly handle the non-linearity of the structure and testing levels may be too far away from operational vibration levels. The FRFs obtained by sine excitation are of higher quality than the results obtained using random noise excitation.

Figure 12. Different Control Strategies in MIMO Sine for GVT modal test
There are two methods to run the MIMO Sine test, through use of specified drive profiles or by defining the target responses, more often the required driving forces. The second testing method requires a so-called system identification to first measure the control channels VS drives FRF matrix. With this known and the target profiles defined for the control channels, the required drive signals can be derived.

Figure 13. MIMO Sine Excitation for GVT modal measurements on aircraft
After the test is prepared and the above settings are configured, the GVT modal measurements are executed to obtain the MIMO FRF measurements. Different configurations of the aircraft assembly are tested with these different excitation techniques to observe the effect of flight flutter. Various configurations are tested based on different payload and fuel configurations to observe the changes in the extracted modal parameters.
Post-Processing and Curve-Fitting
The MIMO FRF measurements acquired through the different steps discussed are then post-processed for further analysis. Various Mode Indicator Functions (MIFs) such as:
Multivariate MIF
Complex MIF
Real MIF
Imaginary Sum
are available to help identify the interested modes within the desired frequency range. These MIFs reach local maxima (peak) or minima (valley) at the natural frequencies of the system.

Figure 14. Different mode indicator functions that assist in identifying modes in GVT modal test
Multivariate MIF (MMIF) takes use of the eigenvalue decomposition and tends to have the minimum value at the modes. The advantage of Multivariate MIF is that multiple referenced data will have multiple MIFs and can detect repeated and highly coupled modes.
Complex MIF (CMIF) is based on the singular value decomposition of the FRF matrix to determine all the major modes observed in the set of FRF signals measured. The CMIF will reach the peak at the modes of system.
The Sum function is the summation of all FRFs measured and illustrates peaks at the structure’s mode. The idea is that when all FRFs are included, all modes will be present in most measurements.

Figure 15. Band selection for choosing frequency range in GVT measured FRFs
Using the above functions, an optimal frequency band is chosen for curve-fitting and extracting the modal parameters from the stability diagram.
The stability diagram is an effective way to display and identify the modes of the structure under test. The stability diagram provides a graphical representation of the system's poles at different mode orders. The stability diagram is constructed by plotting the changes in the mode order of the model. At each mode order, the same curve fitting method is used to compute the poles.
For a single reference case, the curve fitting method is Least Square Complex Exponential (LSCE). For a MIMO test case, FRF signals with respect to multiple reference signals, the corresponding curve fitting method is Poly-reference Time Domain (PTD) method.

Figure 16. Various curve-fitting methods for extracting modal parameters of an aircraft assembly
Another estimation method is Poly-X, which is a frequency domain curve-fitting method. It is the Poly-reference Least Square Complex Frequency Domain (p-LSCF). This provides a faster and more efficient curve-fitting algorithm to identify the modal parameters of a test structure.

Figure 17. Stability diagram to calculate natural frequency, damping ratio and mode shape of aircraft
After the stable poles (poles with stable frequency and stable damping) are chosen, the natural frequency, damping ratio and mode shapes of the system are available.

Figure 18. Modal characteristics of an aircraft assembly obtained through a GVT modal test
Figure 19. Mode Shapes of the aircraft assembly
A good correlation between the experimental and FEA test results helps validate an aircraft assembly and certifies it for other tests such as Normal Mode Testing and more. These tests declare that an aircraft is safe for flying.
Example Case
To briefly illustrate the flow of a ground vibration modal test, a customer’s test case is described below.
The user of a Crystal Instruments’ Spider-80M high channel system installed with the EDM Modal suite needed to execute a Ground Vibration Test (GVT) on their aircraft. This high-channel count test used 100 accelerometers to capture the response of an aircraft along with four modal shakers to excite the aircraft and measure the multiple-reference frequency response functions (FRF) dataset. Burst Random output excitation was used for this test and the multiple-input-multiple-output (MIMO) data was processed using the p-LSCF frequency domain curve-fitter (Poly-X) to extract the modal parameters.
Four modal shakers used to excite the aircraft were placed at different locations. A wireframe model of the aircraft was created, and 100 accelerometers were mounted onto the measurement points according to the mesh-grid created in EDM Modal. The input channels for force sensors and accelerometers were configured accordingly.

Figure 20. 104 input channels configured and mapped according to measurement grid on aircraft
Several output excitation types (such as Random, Sine, etc.) can be used for this Multiple-Input-Multiple-Output (MIMO) modal test. In this case, Burst Random excitation was used to control the duration of the output and to avoid implementing any windowing to the measurement data.

Figure 21. Burst Random output excitation setup for the four modal shakers used in GVT
The time and frequency plots from the single run are analyzed to observe the quality of the one-shot GVT modal test measurement.

Figure 22. Time and frequency plots from GVT modal test on aircraft assembly
The multiple-reference FRF dataset can be curve-fit using the time-domain poly-reference LSCE (PTD) or the frequency-domain p-LSCF (Poly-X) estimator. The frequency and damping tolerances for the stability diagram can be controlled by the user. In this case, the user implemented the fast and efficient Poly-X method to extract the modal parameters.

Figure 23. Stability diagram measured FRFs of the GVT modal test using Time Domain method

Figure 24. Stability diagram measured FRFs of the GVT modal test using Frequency Domain method
The results exemplify the strong technical performance of Crystal Instruments Spider-80M high-channel count system combined with the efficiency of EDM Modal software to execute sophisticated GVT modal testing on complex aircraft structures.
Conclusion
Ground Vibration Tests are carried out to observe flutter of an aircraft and to create a safe flight envelope before take-off operation. The results from these experimental modal tests can also be used to correlate and verify the simulation model results. Hence, GVT is a significantly important process in aircraft assembly development. The high-channel count hardware chassis system by Crystal Instruments is efficient at handling large experimental tests while providing excellent synchronization, dynamic range, and accuracy. The EDM Modal software intuitively handles the geometry, measurement, and post-processing of huge test datasets from complex aircraft assemblies for various configurations. The natural frequencies, damping ratios and mode shapes obtained are further used to optimize the design and reduce the flutter of an aircraft to ensure a safe and efficient flying operation.
For more information about EDM Modal, please visit https://www.crystalinstruments.com/structural-testing
For any questions, please contact us at info@go-ci.com