
Modal Analysis of Headlight Assembly Using EDM Modal
Modal testing provides a crucial verification link in structural design by verifying the accuracy of simulation results and determining the structural characteristics of the actual product.
A headlight assembly (left and right) is used as the test object to study and analyze its modal parameters. The test piece is shown in the following figure.


Modal measurement systems include sensors, acquisition devices, auxiliary tools, etc. The modal analysis system includes the corresponding analysis software.
The acquisition equipment used in the preceding test was the Crystal Instruments Spider-80Xi. The Spider-80Xi is a classic modular acquisition device with eight input channels and can be expanded up to 512 channels. Each channel has a sampling rate of up to 256 kHz. Patented dual 24-bit ADC technology provides high accuracy and high dynamic range. Data collection for a variety of modal test methods is available. Real-time analysis ensures a smooth acquisition and analysis process for the modal test.

The PCB 086C03 modal impact hammer was used to excite the structure. This hammer has a sensitivity of 2.25 mv/N and is suitable for exciting medium or large machinery components.

The acceleration sensor used for acquisition is a PCB piezoelectric single-axis sensor (model 333B30) with a sensitivity of 100 mv/g. The sensor cable uses a 15 m long dedicated shielded wire.

Crystal Instruments EDM Modal Testing & Analysis software combined with acquisition equipment was used. EDM Modal contains modules such as acquisition, modeling, parameter extraction, etc., and supports Poly-X algorithms.
The lamp assembly is bolted down and fixed to a rigid base to simulate the real-world installed in-situ condition of the lights.
There are eight measurement points distributed on the upper surface to represent the measurement grid.
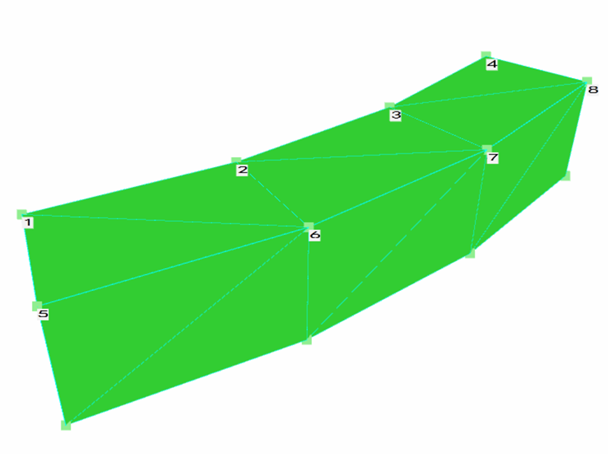
A simple 3D model is created to illustrate the headlight assembly as shown below.

The FFT configuration settings are frequency range at 225 Hz, number of spectral lines is 225, no window is implemented, and three linear averages. Care is taken to ensure the integrity of the excitation signal and the response signal.

With the rubber hammer head selected, the force spectrum is acceptably attenuated within the measuring range.

The roving excitation method is implemented for this modal test. The impacts range from 100 to 200 N. Three sets of independent data obtained in one acquisition test are collected and displayed.


The frequency range at the time of acquisition is 225 Hz. Combining this with the measured FRF curves and frequency band range of interest results in the modal parameter estimation from 15 to 100 Hz.
Headlight assembly (left) vertically oriented modal result
| Mode holding | Frequency (Hz) | Damping ratio (%) |
|---|---|---|
| #1 | 54.449 | 2.335 |
| #2 | 62.869 | 1.301 |
| #3 | 82.137 | 2.105 |
The mode shape animation is as follows:


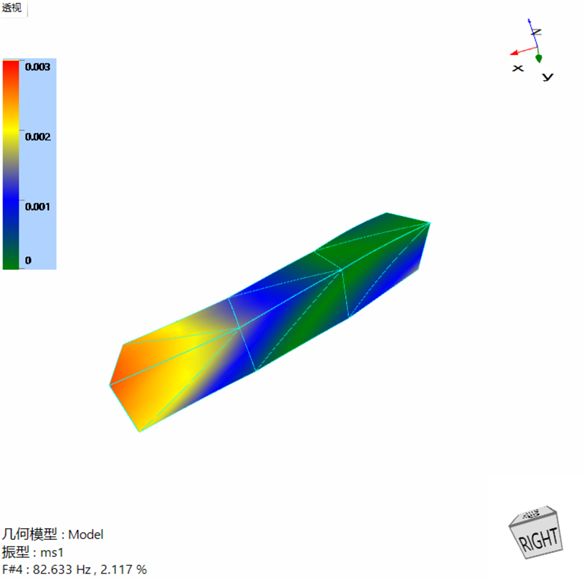
Headlight assembly (left) horizontal modal result
| Mode holding | Frequency (Hz) | Damping ratio (%) |
|---|---|---|
| #1 | 44.924 | 1.193 |
| #2 | 54.299 | 2.421 |
| #3 | 63.168 | 1.217 |
| #4 | 82.633 | 2.117 |
The mode shape animation is as follows:


Headlight assembly (right) vertical modal result
| Mode holding | Frequency (Hz) | Damping ratio (%) |
|---|---|---|
| #1 | 52.376 | 0.869 |
| #2 | 55.873 | 1.892 |
| #3 | 73.517 | 2.201 |
The mode shape animation is as follows:


Headlight assembly (right) horizontal modal result
| Mode holding | Frequency (Hz) | Damping ratio (%) |
|---|---|---|
| #1 | 51.75 | 0.971 |
| #2 | 55.474 | 2.208 |
| #3 | 73.719 | 2.05 |
The mode shape animation is as follows:


The structure of the headlight assembly is complex and composed of a variety of materials, so it has a certain nonlinearity. Using a modal shaker as compared to a modal hammer will help improve the measurement quality and better identifies the modes of the test specimen.
Since it is a preliminary measurement, the number of measurement points is not dense, and a more refined model can help obtain a more concentrated mode shape.