
Modal Analysis of Satellite using EDM Modal
The Canadian Space Agency recently performed the Modal Analysis of a RADARSAT Satellite using five modal shakers. It is important to obtain the modal analysis of the unit-under-test because information about the natural frequencies, damping coefficients and mode shapes can be used to optimize its design and improve its structural behavior. The modal parameters about the mechanical properties of a structure help users understand its vibration characteristics during operating conditions.
The dataset from the experimental modal test is imported into EDM Modal along with the geometry model. The measured FRFs are curve-fit to extract the modal characteristics.
The following figure shows a 3D model of the RADARSAT satellite. The geometry mesh configuration of 240 measurement points is uniformly distributed throughout the satellite. The satellite is excited using five modal shakers attached at five locations, and the response is captured through tri-axial accelerometers. These measurements facilitate obtaining the 3D mode shapes of the satellite.
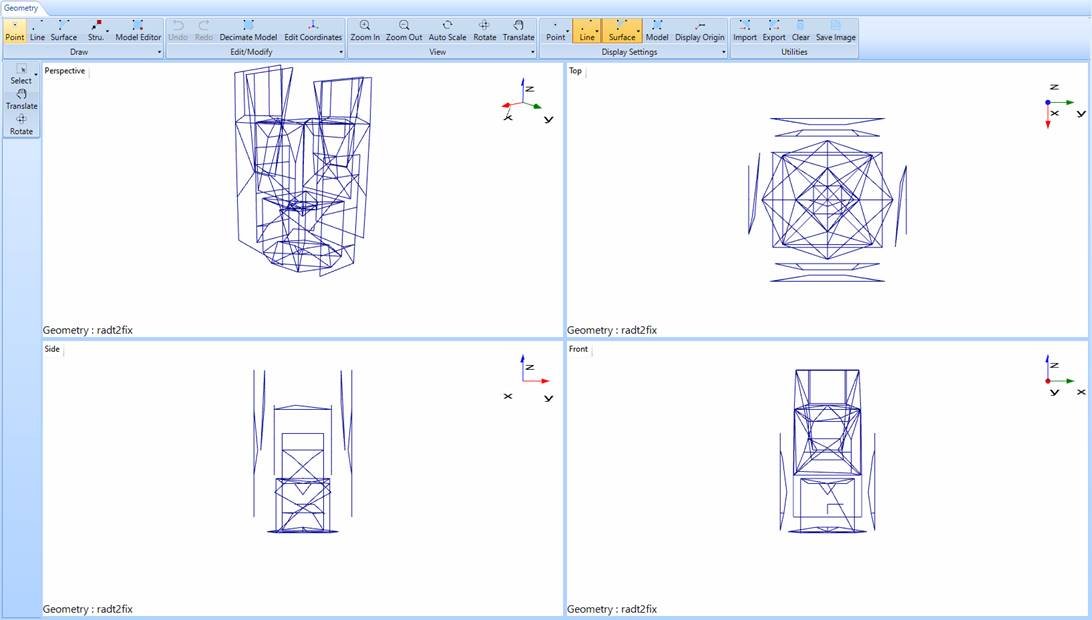
Figure 1. RADARSAT Satellite Geometry
The frequency range is set to 128 Hz and the configuration settings are tuned to produce a frequency resolution of 0.0625 Hz. The Measured FRFs are browsed in and opened to the Modal Data Selection tab. The FRF measurement shows dominant resonance peaks in the desired frequency band.

Figure 2. Modal Data Selection tab showing the Measured FRFs
The peaks at the natural frequencies are indicated using the Complex Mode Indicator Function (CMIF) in the Band Selection stage. The Summed FRF is also used to assist in choosing an appropriate band for the curve-fitting stage.

Figure 3. Band Selection tab
The Poly-X method is used to curve-fit the FRF’s to procure the following stability diagram. Modes are selected within the desired frequency range.
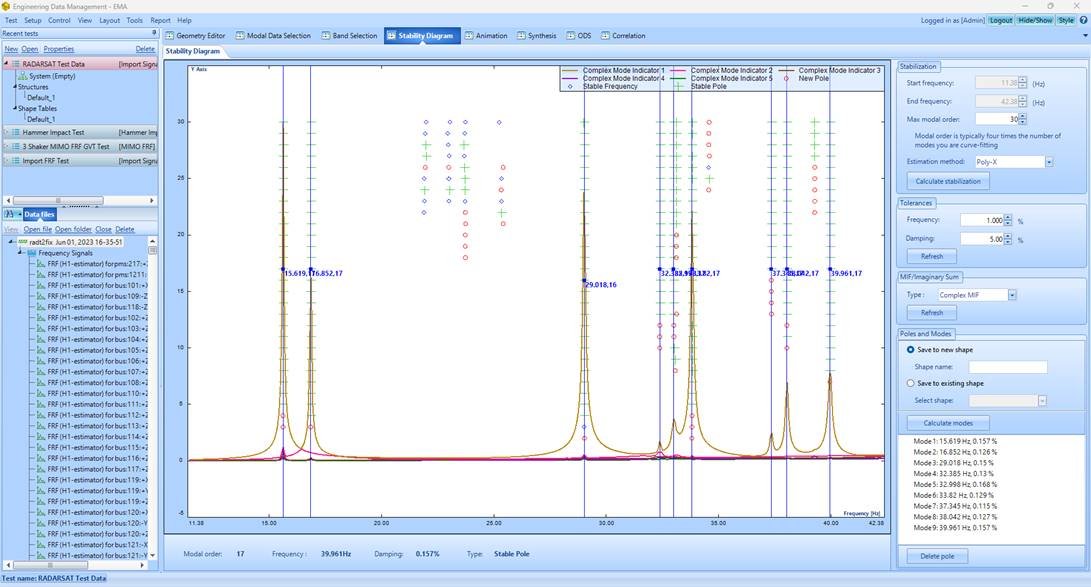
Figure 4. Stability Diagram for the selected modes
The Auto-MAC matrix helps in validating the results. The Auto-MAC matrix below shows that the modes are orthogonal to each other (low off-diagonal elements) and are uniquely identified (high diagonal elements). There are some local modes and global modes present in the modal model of this complex RADARSAT satellite which produces relatively higher off-diagonal elements for some of the modes.
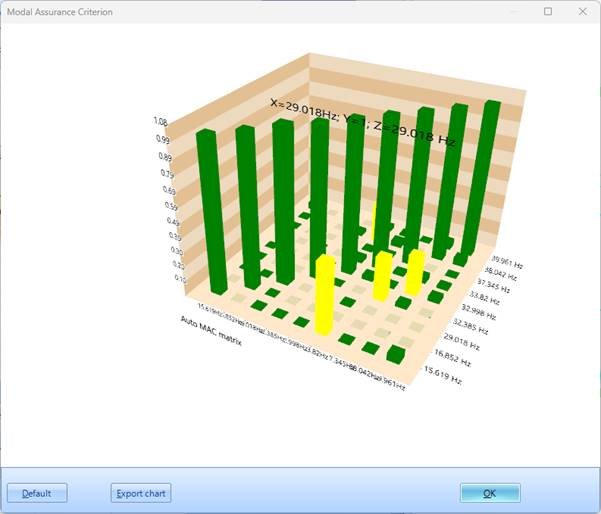
Figure 5. Auto MAC chart for the Satellite Modal Test
The animation of the obtained modes shapes associated with the stable physical poles are shown below.


The results demonstrate the strength and efficiency of the EDM Modal software to process sophisticated modal test data of huge intricate structures.
To learn more about EDM Modal software, visit: https://www.crystalinstruments.com/structural-testing