
Intelligent Drive Clipping – A Better Sigma Clipping
Introduction to Drive Clipping | Download Paper
Clipping, as the name suggests, refers to limiting / clipping the values of a signal that exceeds a threshold. Typically used in Random Testing, the threshold is expressed in terms of the signal’s standard deviation (σ).
For example, if we set a clipping value of 3σ, this means that any drive signal values exceeding 3σ are capped at a maximum of 3σ. Since any clipping operation will inevitably change the shape of drive signal in the time domain, usually the control dynamic range will be significantly reduced once clipping is applied. In other words, the control signal will not match the targeted profile due to changes to the drive signal in the time domain. This has been a great challenge in the Random controller development.
Sigma Clipping vs Kurtosis Control
In the random control industry, there exists a concept called Kurtosis Control. For this paper, it is imperative to make a clear distinction between Kurtosis Control and Sigma Clipping. As the name suggests, Kurtosis control is a test mode that controls distribution of the random vibration on the control channel. In real world vibrations, environments are characterized by signals that have a high kurtosis value of 5-8, compared to a typical gaussian process which has a value of 3. For a gaussian process, the higher peak values will be less than 3*RMS of the signal 99.7% of the time, but real-world vibrations often have peaks that are 5 to 10 times the RMS of the signal. Kurtosis is a measure of this “peakedness” and can be expressed as the ratio between the fourth statistical moment over the square of the second statistical moment. The equation below shows this expression for N samples -

Sigma Clipping on the other hand, is applied on the drive signal to maximize the power capacity of the shaker amplifier system. When sigma clipping is applied, the system can potentially enter a non-linear region which can lead to poor and distorted spectral control and other drawbacks which limit the usability of sigma clipping.
To address these issues, Crystal Instruments introduces an innovative clipping algorithm called Intelligent Clipping in EDM version 11.1.
This innovative algorithm adjusts the drive signal to minimize the loss of dynamic range in the control signal relative to the target profile. Additionally, it significantly reduces the amplitude of out-of-band frequency content in the drive signal, and hence outperforming the legacy clipping method.
Why Sigma Clipping?

Figure 1. Hardware Setup
To understand why Sigma Clipping is used, we need to also understand how the physical hardware is set up in the control process. As shown in Figure 1, an input profile is defined in the frequency or time domain. The controller sends a drive output signal to the amplifier which drives the shaker and hence the Device Under Test (DUT). A control accelerometer mounted on the DUT provides a feedback signal to the controller, enabling it to dynamically adjust the drive signal to maintain accurate control.
Sigma clipping is used to prevent the tripping of amplifiers when input range of amplifiers is less than the drive signal needed to achieve a target GRMS. For instance, if we need to achieve a target GRMS of profile, we will need a sufficient drive signal from the controller going into the amplifier. Every amplifier comes with a certain input range and there can be situations where this input range is insufficient for the shaker to reach a target GRMS. In such cases, having clipped drive signals with reduced peaks will prevent the amplifier from tripping while the power of amplifier can be optimally used. Hence, our new sigma clipping can be used to maximize the power rating of the shaker amplifier system without tripping the power amplifier circuit and not compromising on the dynamic range of the control profile.
To better understand this, let’s consider an example with an amplifier range of ±10V. With no sigma clipping (i.e. σ =5), the maximum RMS of a drive signal is 2V and the Amplifier Output Power is 4* Gain2 watts, as shown in Figure 2. Here the parameter “Gain” is the overall gain of the power amplifier that drives the shaker.

Figure 2. Drive signal time stream with σ = 5 and a given Amplifier Range
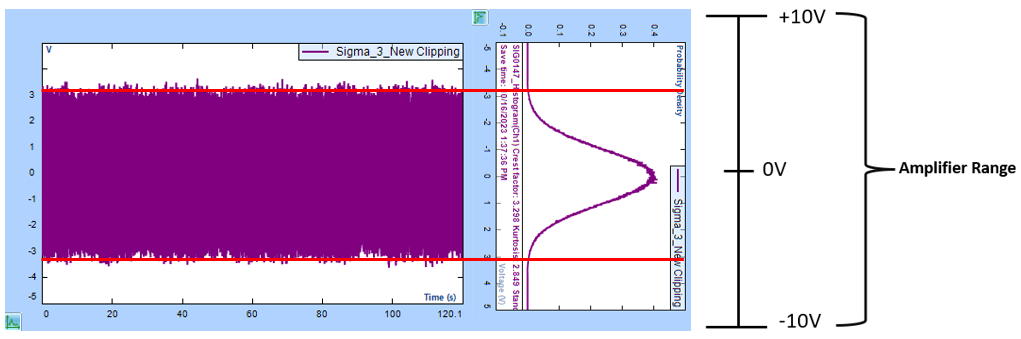
Figure 3. Drive signal time stream with σ = 3 and a given Amplifier Range
Consider Figure 3, with the aid of the new “Intelligent” drive clipping and a σ clipping value of 3, the maximum RMS of the drive signal using the same amplifier is 3.33V. The Amplifier Output Power = 11.08 * Gain2 watts. This corresponds to a 60% increase in the RMS of the drive signal and 1.77 times of power increase at the output end! In other words, after sigma clipping is applied, the usable power of the amplifier can be much higher.
This is the main reason why sigma clipping is widely used in the vibration testing industry. However, applying the truncation to the drive signals will result in significant loss of control dynamic range. This issue is addressed in detail with the rest of this paper.
Test Configuration
A Random vibration test was run to understand the improvements made to the drive clipping algorithm developed by Crystal Instruments. The motive here was to check the control dynamic range with and without clipping by adding a -90dB notch into the test profile. By keeping a standard configuration for the FFT parameters for Block Size, overlap ratio etc., we tested the feature using the Test Profile shown in Figure 4.
1. Test Profile

Figure 4. A test profile designed to show high control dynamic range
2. Test Parameters
| Number of Spectral Lines | 1600 |
| DOF | 120 |
| Number of Averages | 60 |
| Overlap Ratio | 50% |
3. Other test details
No shaker was used to conduct this test, and the output of the controller was directly fed to the input channel. This is called a bare wire test.
This eliminates the effects of the shaker dynamics which can limit the controller’s ability to fully meet the profile demands.
Every shaker (which is a mechanical system) comprises of its own mass, stiffness and damping which will make it hard to fully visualize the capabilities of the controller.
Also, the profile used is aggressive as it comprises of a 90dB control dynamic range requirement.
4. Legacy (Old) Clipping Results
To visualize the effects of applying Intelligent Drive Clipping, we need to analyze Histograms and Auto Power Spectra of Control and Drive channels.
4.1 Histogram
| Blue | σ = 3 with Old Clipping Method |
| Green | σ = 3 with Old Clipping Method |

Figure 5. Histogram plot to compare no sigma clipping and old sigma clipping.
Looking at the histogram plot in Figure 5, where we have applied a clipping value of σ = 3, we limit and hard clip the drive signals values that go above 3σ. The signal with no σ clipping demonstrates the expected Gaussian behavior of an unclipped drive signal. The blue curve demonstrates that the old σ clipping method sharply truncates signal amplitudes at ±3σ which deviates from its Gaussian nature, leading to a loss in the natural signal distribution. This hard clipping introduces two main drawbacks which are explained in Section 4.2 and 4.3.
4.2 Auto Power Spectrum of Control Channel

Figure 6. Auto Power Spectrum of Control Channel (Bare-Wire)
Figure 6 shows the Auto Power Spectrum of the control channel. One immediate observation we can make is the loss in dynamic range of the control signal. The dynamic range of a controller refers to its ability to control maximum and minimum values simultaneously. With no σ clipping, the control profile (green) is very close to the actual test profile (black), which is the desired result. But when a clipping of 3σ is applied, there is a large reduction in the dynamic range. The control profile with 3σ (blue) using the old clipping method has a dynamic range which is 45dB lesser than the one without any clipping.
The other issue we can notice is that there is an increase in amplitude in the out-of-band frequency components (beyond 2kHz), which can severely affect the DUT if there is a resonant frequency present in this range.
To understand the reason for these two drawbacks, we need to look at the Auto Power Spectrum of the drive signals presented in section 4.3.
4.3 Auto Power Spectra of Drive Channel
1. Reduction in the Dynamic Range: shows the Auto Power Spectrum of the drive signal with and without sigma clipping. The drive signal's dynamic range (indicated by the presence of a notch between 300 Hz and 700 Hz) is 30 dB better compared to the drive signal processed using the old method with a σ clipping value of 3. The significant loss in dynamic range with the old clipping method reduces the controllers ability to accurately reproduce the target profile, leading to signal degradation.
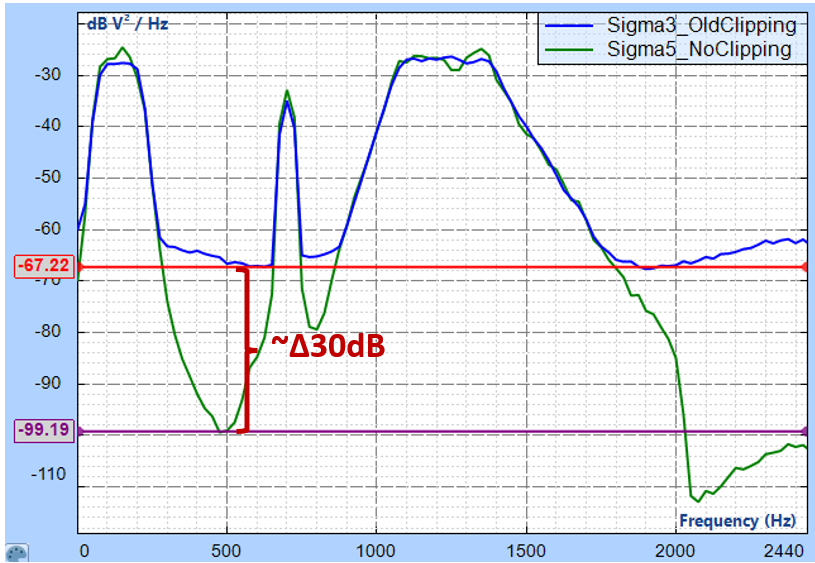
Figure 7. Drive signals Auto Power Spectrum (bare-wire)
2. Introduction of out-of-band frequency components to the signal: Limiting or hard clipping the peak values of a signal introduces out-of-band frequency components, as illustrated in Figure 8. This comes with a significant drawback as the resonance frequencies of the Device Under Test (DUT) may overlap with these out-of-band frequency components, potentially causing damage to the DUT.
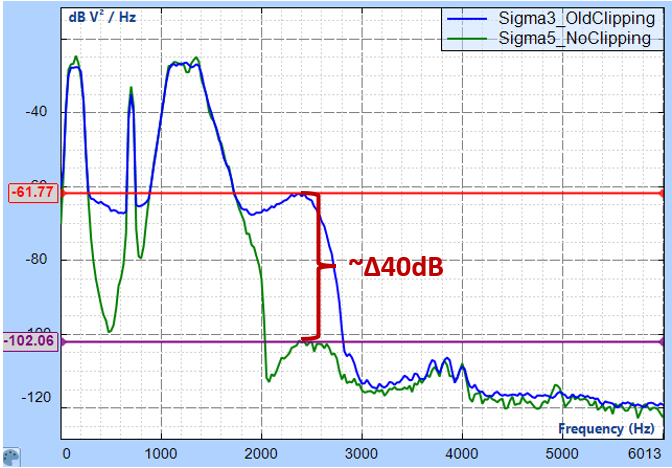
Figure 8. Drive Signal Auto Power Spectra for entire frequency range (bare-wire)
These observations emphasize the need for improved algorithms that suppress these high-frequency components while maintaining the desired signal characteristics.
5. Intelligent Clipping Algorithm
To address these drawbacks, Crystal Instruments have developed an innovative algorithm which significantly limits both issues. Rather than hard clipping the signal, the spectral contents of the profile are considered for a more “intelligent” clipping process that still meets the original motivations of protecting the amplifier.
To better understand the algorithm used in this process, let’s consider a flow chart for a typical random control process to show how the new clipping method integrates with it.

Figure 9. Random Control Process with Intelligent Drive Clipping
In a random control process, the control PSD is continuously compared with the reference PSD to ensure that the generated vibration adheres to the required specifications. With the introduction of the new intelligent clipping method, an additional layer of complexity has been incorporated. This method performs a secondary comparison of the control PSD (post-clipping) with the reference spectrum, ensuring that the dynamic range is preserved. The flowchart below illustrates this process in detail:

Figure 10. Flowchart for Intelligent Drive Clipping
The “intelligent” clipping method is an iterative technique designed to minimize the discrepancy between the control and reference spectra. This method dynamically adjusts the drive signal to reduce the discrepancy while maintaining key characteristics such as preserving the dynamic range and minimizing the introduction of out-of-band frequency components. Additionally, it prevents clipping in the time domain, which helps to suppress the amplitudes of out-of-band frequency components more effectively.
6. Intelligent Clipping Results
6.1 Histogram
| Blue | σ = 3 with Old Clipping Method |
| Green | σ = 3 with Old Clipping Method |
| Red | σ = 3 with Intelligent (New) Clipping Method |

Figure 11. Histogram comparing old and new clipping methods
Figure 11 highlights the presence of a bump associated with the old clipping method, indicating the use of a hard clipping strategy. This issue has been effectively resolved with the new clipping method, which produces a much smoother PDF distribution. The smoother distribution achieved with the new method highlights its ability to retain the natural Gaussian characteristics of the signal while still applying the necessary clipping constraints. Despite setting σ = 3, a minor deviation is observed, where approximately 0.26% of the values fall outside the specified range. This deviation was calculated over a one-hour recording with a sampling rate of 25 kHz and reflects the inherent trade-offs in maintaining both signal fidelity and control accuracy.
6.2 Auto Power Spectra of Control and Drive Channels with Intelligent Clipping
Figure 12 illustrates the Auto Power Spectra (APS) of the control signal, comparing the performance of sigma clipping methods (Old Clipping with σ =3, No Clipping with σ =5, and New Clipping with σ =3) against the target profile. The plot highlights a significant improvement in the dynamic range of the controller with the implementation of the new sigma clipping method. The new sigma clipping method also maintains better adherence to the target profile across the frequency range, demonstrating smoother behavior and reduced deviations from the desired performance.

Figure 12. Auto Power Spectra of Control Signal (bare wire)

Figure 13. Auto Power Spectrum of Drive Signal (bare wire)

Figure 14. Auto Power Spectrum of Drive Signal for entire frequency range (bare wire)
Figures 13 and 14 showcase the Auto Power Spectra of drive signals, comparing the performance of the old and new sigma clipping methods. The new clipping method demonstrates a substantial improvement in dynamic range, reducing the gap from Δ30dB to Δ16dB. Additionally, it significantly lowers out-of-band frequency amplitudes, from Δ40dB to Δ10dB, effectively minimizing undesired resonance and protecting the Device Under Test (DUT) from potential damage.
7. Tests with a Bench Top Shaker
A 100N Sentek Dynamics benchtop shaker (BT-100) with a head expander was used to conduct this test.
A PCB accelerometer with sensitivity of 100mV/g was mounted on the head expander to provide a feedback control signal to the controller.
As the shaker dynamics come into play, we have used a slightly modified test profile with a reduced dynamic range of 50dB as shown in Figure 15.
Section 7.1 and 7.2 details results from this test.

Figure 15. Test Profile with 50 dB dynamic range
7.1 Auto Power Spectrum of Control Signal

Figure 16. Auto Power Spectrum of Control Signal to show dynamic range at notch (shaker-test)
Figure 16 illustrates the Auto Power Spectra (APS) of the control signal, comparing the performance of sigma clipping methods (Old Clipping with σ =3, No Clipping with σ =5, and New Clipping with σ =3) against the target profile when run on a shaker. Since this is a lower dynamic range profile (compared to the bare-wire test), we still see an improvement of Δ10dB in the control dynamic range between the old and new σ clipping methods. Notably, the new clipping method produces a control signal that is nearly identical to the no-clipping case. This result highlights the ability of the new method to maintain excellent adherence to the target profile, representing a significant advancement over the legacy approach.

Figure 17. Auto Power Spectrum of Control Signal to show out of band frequencies (shaker-test)
Figure 17 highlights the APS of the control signal, with a focus on the out-of-band frequencies observed during the shaker test. Similar to the bare-wire test, the new clipping method achieves a 34dB reduction in the amplitude of out-of-band frequencies compared to the old clipping method. This effectively protects the DUT from potential adverse effects, enhancing the reliability and safety of the testing process.
8. Conclusion
In a Random vibration test, with the usage of Intelligent Drive Clipping method developed at Crystal Instruments, the user can ensure a larger output power from the power amplifier that drives the ED shaker and achieve a target GRMS of a profile without tripping the amplifier system. The new method also significantly reduces the inherent drawbacks of hard clipping such as loss in dynamic range of control signals and addition of high frequency components.
9. References
[1] Bishop, C.M. and Bishop, H., 2023. Standard Distributions. In Deep Learning: Foundations and Concepts (pp. 65-110). Cham: Springer International Publishing.
[2] Kihm, F., Ferguson, N.S. and Antoni, J., 2015. Fatigue life from kurtosis controlled excitations. Procedia Engineering, 133, pp.698-713.
[3] Steinwolf, A., 2012. Random vibration testing with kurtosis control by IFFT phase manipulation. Mechanical Systems and Signal Processing, 28, pp.561-573.